Best 8 Engineering Analytics Platforms of 2026
9 min read• Mar 04, 2026
Written by

Milestone Team

Engineering analytics platforms are fundamentally different from classical reporting tools. These aren’t just dashboards that visualize JIRA tickets or GitHub commits. They’re intelligent systems that surface bottlenecks, inefficiencies, and friction points that slow delivery. Think of them as diagnostic tools for your development process, instruments that measure what matters and explain why things are the way they are.
Modern software development lifecycles are complex. Microservice architectures, distributed teams, and continuous deployment create an environment where human intuition alone can’t keep pace. Meanwhile, economic pressures demand efficiency, leadership seeks proof that engineering investments deliver results, and modern analytics platforms provide exactly that.
An engineering analytics platform spans your delivery toolchain, source control, CI/CD, incident management, and work tracking, and turns activity data into workflows and decisions. Instead of “here are charts,” it aims to identify:
Today, hybrid work is common, toolchains are fragmented, and AI-assisted coding has become the norm, increasing throughput. But these trends also increase the risk of review, testing effort, and insufficient deployment controls. A good platform helps you see the system, not just the people.
Below are eight options that commonly arise when teams evaluate leading engineering analytics tools.
Source: https://linearb.io/
LinearB’s strongest angle is workflow visibility across the PR lifecycle, with automation that reduces review drag. Its WorkerB automation is designed to deliver the right context to the right people at the right time. For example, it supports workflow automation via Slack integrations for direct notifications.
Core strengths:
Ideal use cases: Teams struggling with code review delays find LinearB especially valuable. Organizations with 20-200 engineers see the most impact, small enough that individual contributor patterns matter and large enough that manual tracking becomes impossible.
Limitations: While powerful, the automation features require careful tuning. Teams report that the default settings can be overly aggressive. Additionally, LinearB’s pricing scales with team size, making it costly for larger organizations.
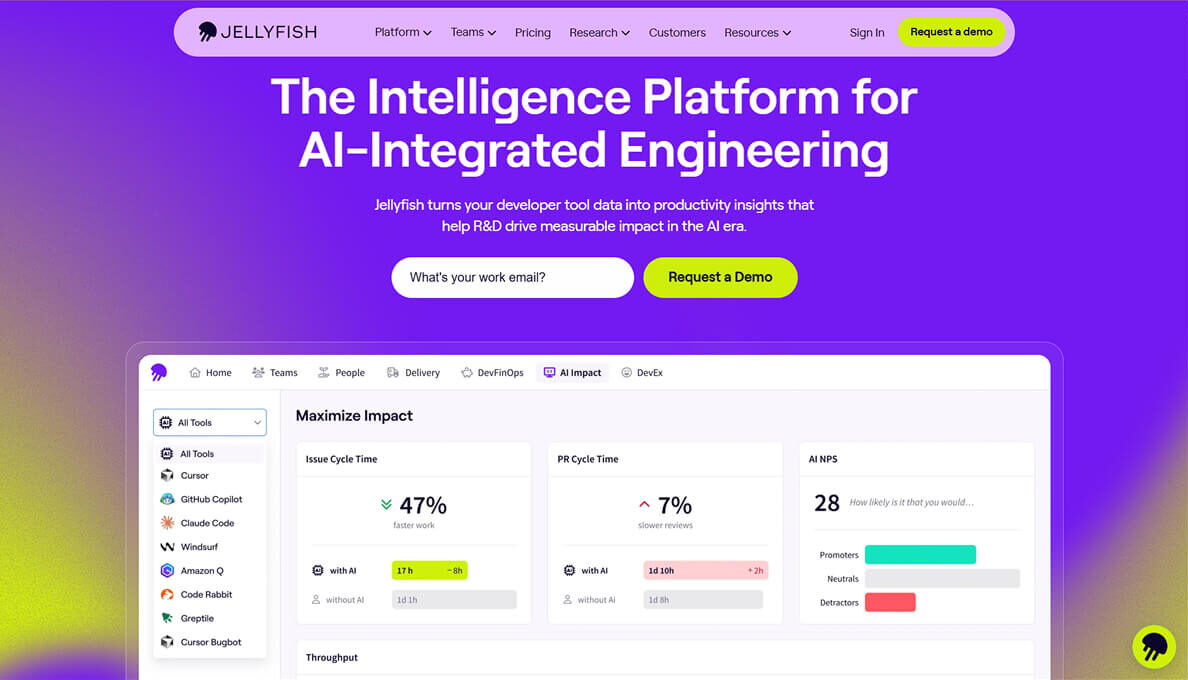
Source: https://jellyfish.co/
Jellyfish is for leaders who need to turn engineering work into a story that explains its impact on investments, alignment, and delivery. It is recognized as an intelligence platform for software engineering, with a focus on its integration with other engineering tools.
Core strengths:
Ideal use cases: Larger organizations (200+ engineers) derive the most value from Jellyfish’s capabilities. Companies undergoing digital transformation or managing multiple product lines find its strategic alignment features invaluable. It’s particularly strong for organizations that need to justify engineering headcount or defend R&D budgets to boards.
Limitations: Complexity is Jellyfish’s double-edged sword. The platform offers incredible depth but requires more configuration. Smaller teams often find it overkill. The learning curve is steep. Expect weeks, not days, to unlock full value.
Source: https://www.swarmia.com/
Swarmia has a “teams-in-control” feel. Its working agreements let teams define targets and habits to improve, then track progress over time. It also integrates with Slack to deliver PR and workflow notifications in a more in-the-flow way.
Core strengths:
Ideal use cases: Engineering organizations concerned about burnout or retention find Swarmia’s human-centric approach valuable. Fully remote teams benefit from Swarmia’s distributed collaboration analytics. Startups and scale-ups (10-150 engineers) are their sweet spot.
Limitations: Swarmia’s emphasis on developer experience means it offers less granular delivery metrics than competitors. Finance teams seeking budget optimization insights might find it insufficient. The platform’s more recent market entry also means fewer integrations than established players.
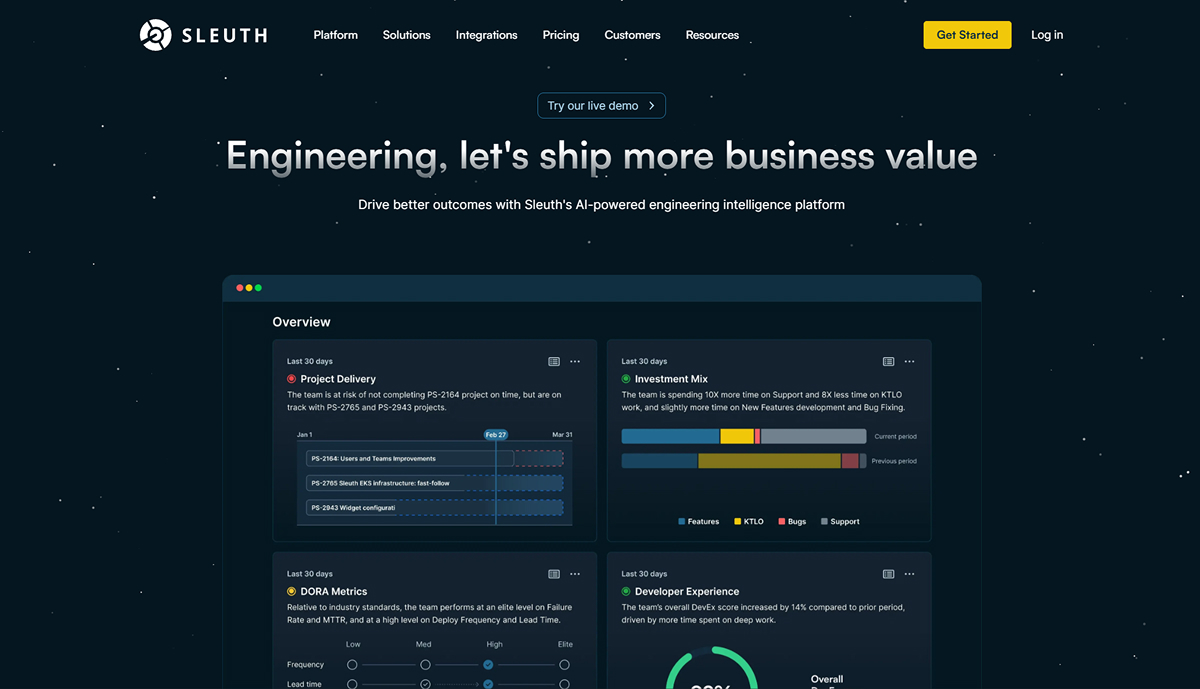
Source: https://www.sleuth.io/
Sleuth focuses tightly on deployment-centric visibility and DORA metrics. It tracks DORA metrics by monitoring deployments and letting teams drill into deployment-level context.
Core strengths:
Ideal use cases: DevOps teams practicing continuous deployment need Sleuth’s capabilities. Organizations with complex microservice architectures, where manual change tracking is impossible, benefit immensely. Companies using DORA metrics (deployment frequency, lead time, change failure rate, mean time to recovery) find Sleuth purpose-built for their needs.
Limitations: Sleuth’s narrow focus limits it to pre-deployment workflow optimization. Teams want a comprehensive engineering analytics solution, which requires additional tools. Its value proposition is strongest for organizations that already practice continuous delivery with monthly release cycles, and those that don’t won’t extract much benefit.
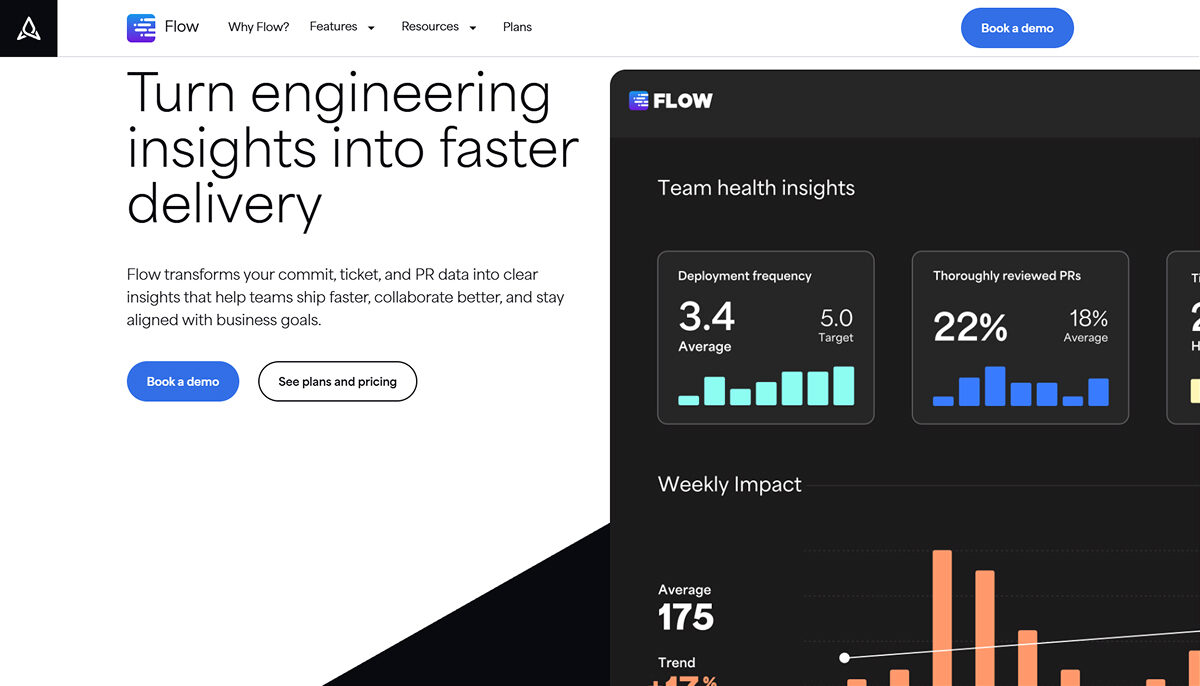
Source: https://appfire.com/flow
Flow has been in the engineering intelligence space for years and positions itself around value stream visibility and engineering transformation, helping leaders improve predictability and workflow efficiency across teams.
Core strengths:
Ideal use cases: Organizations with substantial technical debt benefit from Flow’s work pattern analysis. Companies investing heavily in upskilling engineers find Flow’s learning integration valuable. Mid-sized teams (50-300 engineers) in traditional enterprises constitute Flow’s core market.
Limitations: Flow’s commit classification algorithm isn’t always accurate, and complex changes can be misclassified. The platform’s reporting can feel dated compared with newer entrants. Some users find the Pluralsight integration forced rather than natural.
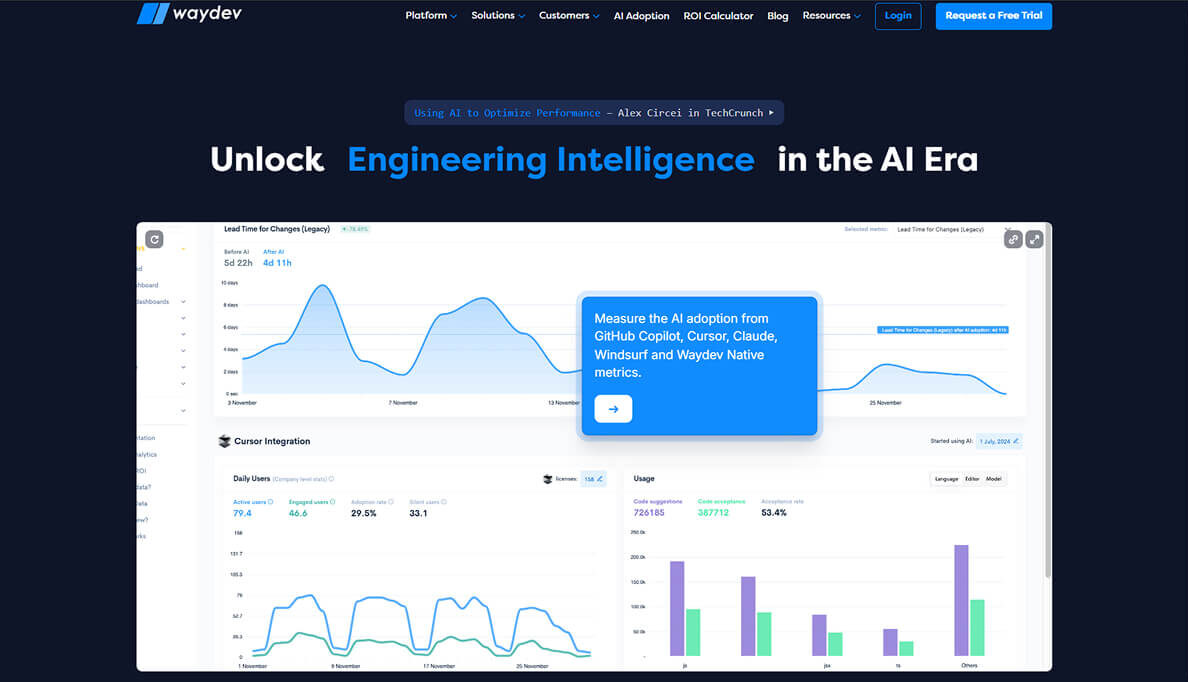
Source: https://waydev.co/
Waydev positions itself as a developer productivity insights platform and explicitly references frameworks such as DORA and SPACE. It also offers onboarding-focused guidance in its documentation (on using metrics to onboard and ramp new engineers effectively).
Core strengths:
Ideal use cases: Rapidly growing teams that need structured performance management find Waydev valuable. Organizations transitioning from subjective to objective performance evaluations benefit from these frameworks. Companies with distributed teams appreciate how these frameworks surface the impact of remote contributors.
Limitations: Individual-focused analytics can foster unhealthy competition if misused and may be perceived as surveillance. The platform requires careful change management to prevent it from feeling like surveillance. Waydev’s process optimization features lag behind competitors focused solely on workflow efficiency.
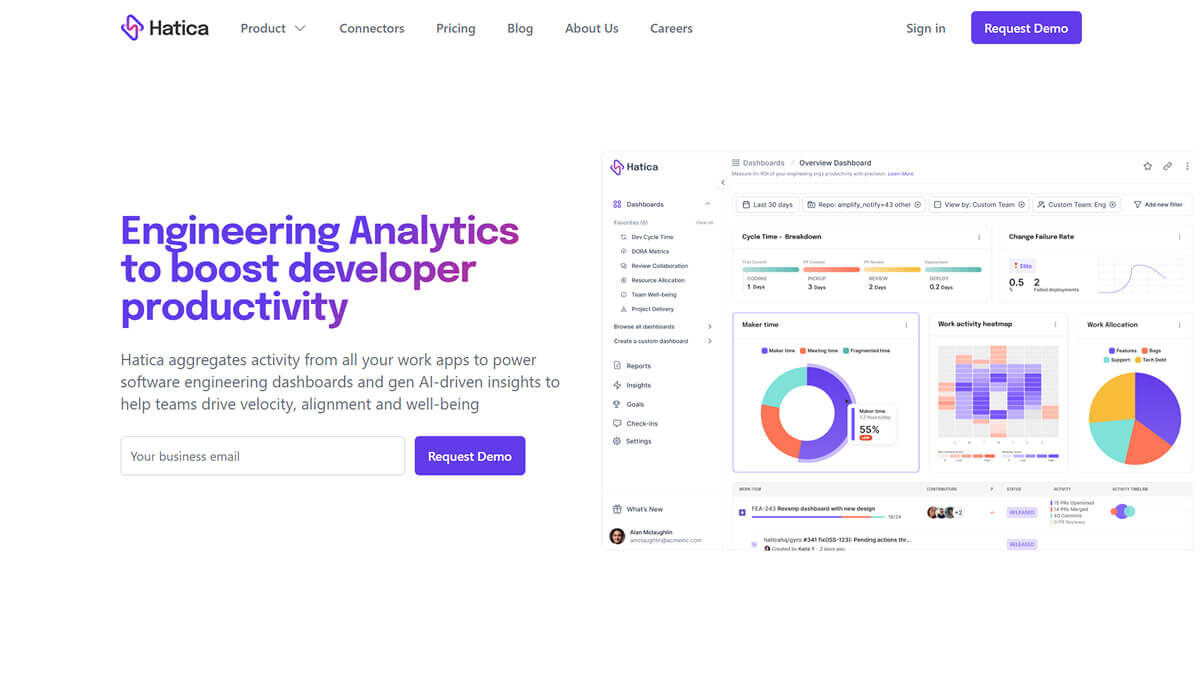
Source: https://www.hatica.io/
Hatica is often chosen by teams that want engineering analytics with easier onboarding and clearer pricing tiers. Pricing is public and increases with each additional member. There are levels for deeper dashboards and longer histories.
Main strengths:
Ideal use cases: Startups and small teams (5-50 engineers) find Hatica’s value proposition highly compelling. Companies new to engineering analytics are asking how easy it is to use. Even companies with small tool budgets can still get professional-grade insights.
Limitations: Hatica lacks the advanced features that larger companies need. Its benchmark data isn’t as comprehensive as that of more established players. The platform’s visualization tools work, but they’re not very advanced.
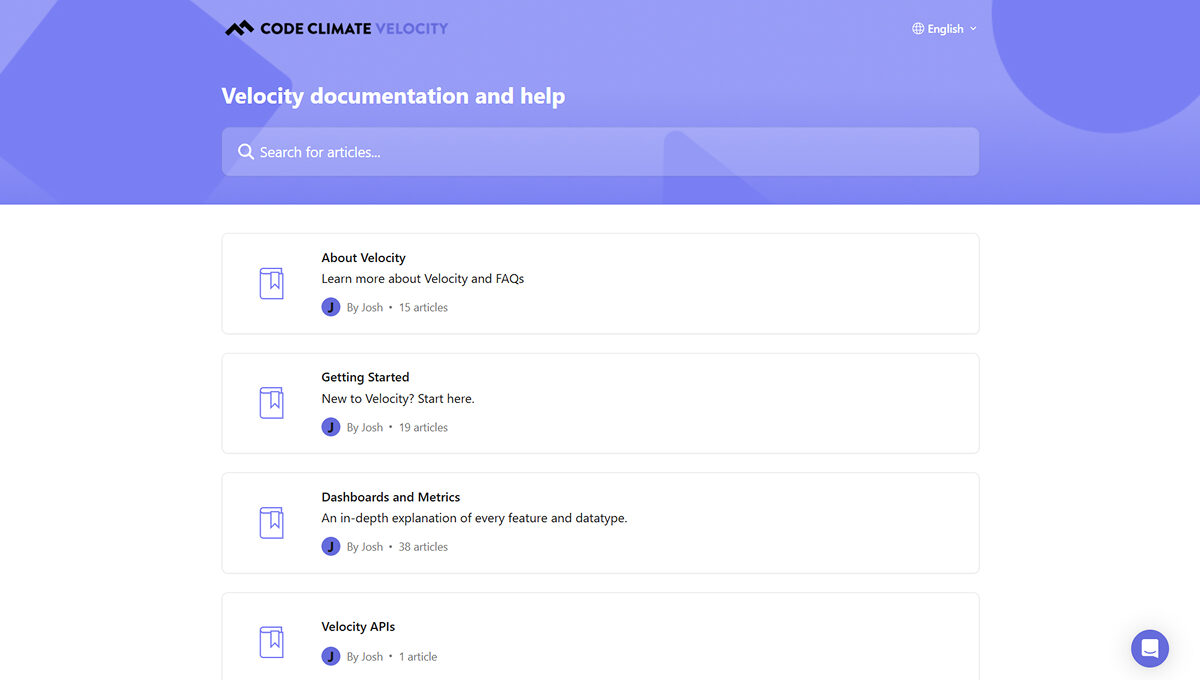
Source: https://docs.velocity.codeclimate.com/en/
Velocity by Code Climate is a software engineering insights platform with extensive documentation on metrics such as cycle time, deployment frequency, PR risks, review speed, rework, and more.
Main strengths:
Ideal use cases: Teams dealing with technical debt, like Velocity’s balanced point of view. Recalibration helps companies that have focused too much on speed at the expense of quality. If you already have a Code Climate Quality subscription, it integrates with your other services. Refactoring’s business impact calculations help engineering leaders justify their investments.
Limitations: Because Velocity focuses on quality, it doesn’t optimize workflows as precisely as its competitors. Teams without code quality issues might not find the differences as compelling. When used with Code Climate, the platform works best. Code Climate’s value on its own is more limited.
Platform Comparison Overview
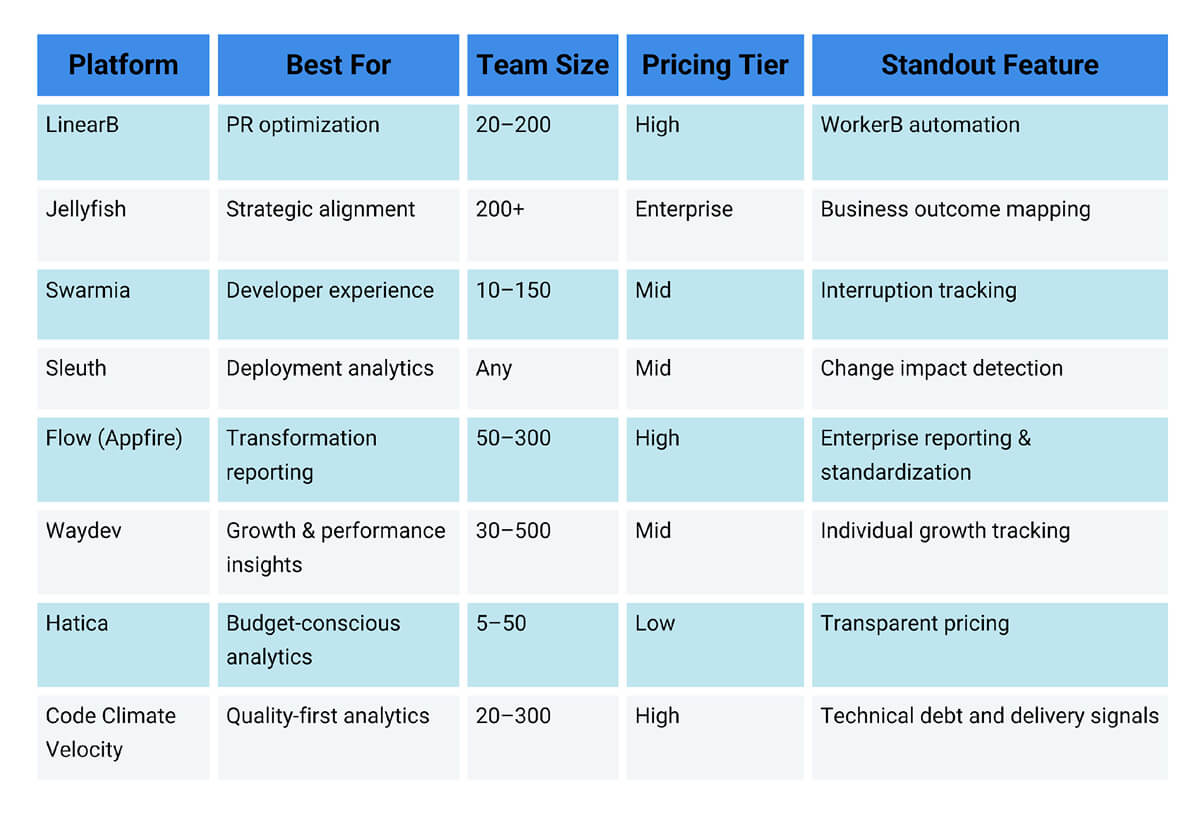
Selecting the right engineering analytics solution isn’t about finding the “best” platform. It’s about finding the best fit for your specific context. Three factors should drive your decision: team size, data maturity, and organizational goals.
You can ask questions such as “Where is work getting stuck? (review, CI, QA, deploy)”, “How do we improve release confidence? (change failure rate, recovery, deploy risk)”, and “Where are we spending engineering capacity? (initiatives, roadmap vs. maintenance)”.
This will help you choose the platform with features that address the questions you need to address the most.
Another factor is the size of your team. Some platforms are better suited to large teams, while others are better suited to small startups.
The engineering platform you choose needs to integrate with the tools you use and align with how you use them. For example, the platform may support integrations with GitHub and Jira, but you also have to ask:
A platform’s accuracy is only as good as your integration, tailored to your unique workflow.
Engineering analytics platforms have evolved from being nice-to-have tools to becoming fundamental infrastructure for modern development teams. The eight platforms discussed have unique strengths that align with different organizational needs. Therefore, the best platform for your team will be the one that meets your needs.
These top engineering analytics platforms make engineering work more visible, understandable, and improvable. The platform that helps you understand your path forward should be your chosen one, and its insights should drive meaningful change.
Most of them connect via APIs and built-in connectors to common tools such as Git providers, ticketing systems, CI/CD, and incident management tools. Some also support marketplace apps and exports. For instance, GitLab’s value stream analytics runs directly in GitLab and uses merge requests and issue events to determine a project’s stage.
You can benefit from moderate maturity: consistent repos, a ticketing workflow, and CI/CD events. Higher maturity (linking issues → PRs → deploys and clean team ownership) enables more accurate bottleneck detection and forecasting.
Typically, organizations achieve early returns by focusing on a single bottleneck, such as review delays, and making targeted changes. Achieving sustained ROI requires that insights drive changes in the workflow and that leaders use the data responsibly, prioritizing investment over punitive action.
Yes. Smaller teams can benefit from flow insights and DORA-style delivery visibility, especially when they ship frequently and feel “busy but stuck.” GitLab’s built-in analytics can be a simple way for teams to get started.
Most vendors use role-based access controls, scoped connectors, and security programs documented in trust centers. In practice, you should check:
Sign up to our newsletter
By subscribing, you accept our Privacy Policy.