Tracking the duration of work in modern software development is pivotal. Organizations often struggle to derive meaningful insights from time-based performance metrics such as lead time, cycle time, and change lead time. The struggle arises because the organization cannot tell the difference between them. Even though these three metrics might sound similar, they capture different parts of the software development life cycle.

Let’s explore lead time, cycle time, and change lead time to better understand their similarities, differences, and usage.

What is Lead Time?

Lead Time

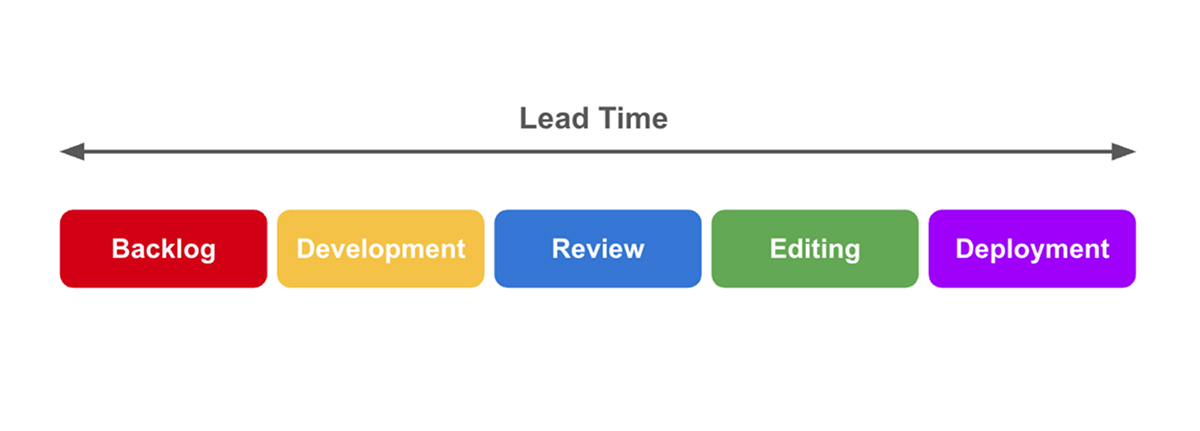
Lead time starts when a request enters the backlog and ends when the related code is deployed live in production.

What it covers

  • Backlog wait: Grooming, prioritization, design sign-off.
  • Development: Coding, code review, rework.
  • Release: Merge, automated tests, deploy, feature-flag rollout.

Key characteristics

  • Mirrors the full customer wait.
  • Allows product managers to forecast with fewer surprises.
  • Exposes bottlenecks outside engineering, such as legal review or UX debt.

Example: A payments team logs a Refund API ticket on June 1. Work lands in prod on June 15. The lead time is 14 days, even if developers only coded for five.

How to reduce lead time

  • Improve backlog grooming.
  • Automate release approvals.
  • Implement faster feedback loops from stakeholders.

What is Cycle Time?

Cycle Time

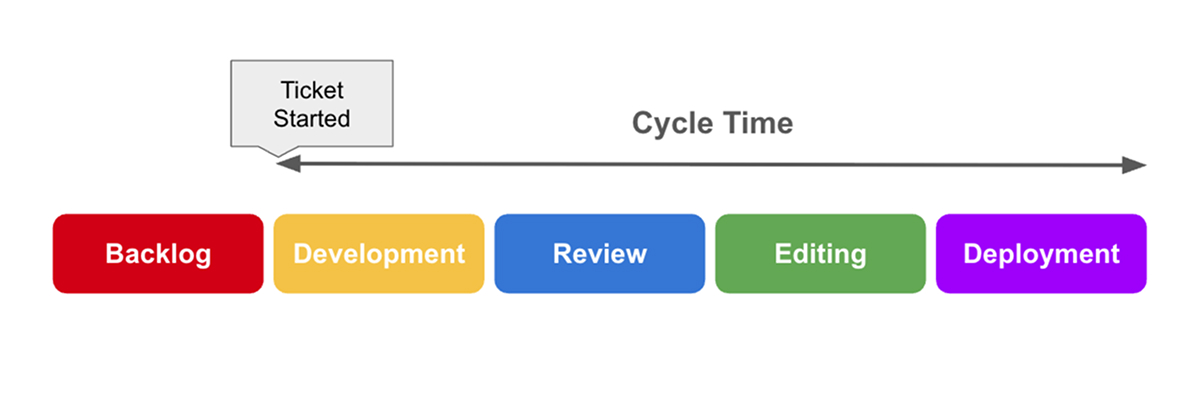
Cycle time begins when work moves to “In Progress” and ends when the change is merged (or marked “Ready for QA”).

What it covers

  • Coding
  • Internal testing on the branch
  • Peer review and rework

Key characteristics

  • Shows how quickly the team converts ideas into merge‑ready code.
  • Shorter cycle time often means smaller, safer pull requests.
  • Makes sprint retros more actionable by exposing review bottlenecks.

Example: A developer starts a task on June 5 and merges it on June 9. Cycle time = 4 days.

How to reduce cycle time

  • Break work into smaller, independent tasks.
  • Enforce a daily pull-request review rotation.
  • Use automated linting and unit tests to catch issues early.
  • Track median cycle time, not the average, to ignore outliers.

What is Change Lead Time?

Change Lead Time

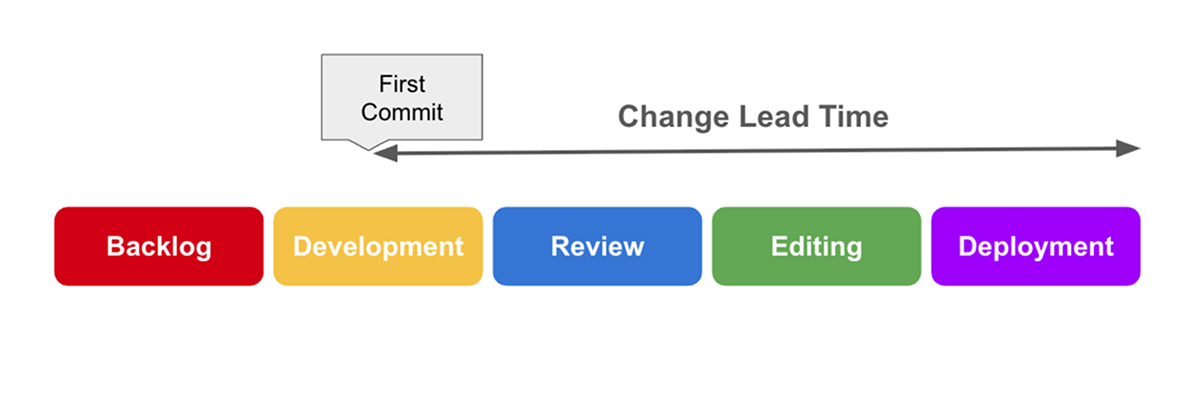
Change lead time (also referred to as lead time for changes) begins at the first commit and concludes when that commit is deployed live in production.

What it covers

  • Build and package steps
  • Automated test suites
  • Security scans, artifact promotion, and deployment

Key characteristics

  • Measures CI/CD pipeline speed and stability.
  • Directly reflects how fast users see value after code is written.
  • Aligns with the DORA “lead time for changes” metric used for benchmarking.

Example: A commit is pushed at 10:00 a.m., and the deployment finishes at 11:15 a.m. Change lead time = 1 hour 15 minutes.

How to reduce change lead time

  • Parallelize build, test, and security-scan stages.
  • Replace manual approvals with automated policy checks where possible.
  • Fix flaky integration tests within one day.
  • Add on-demand or auto-scaling build agents to avoid queue delays.

Lead Time vs. Cycle Time vs. Change Lead Time

Lead Time vs. Cycle Time vs. Change Lead Time

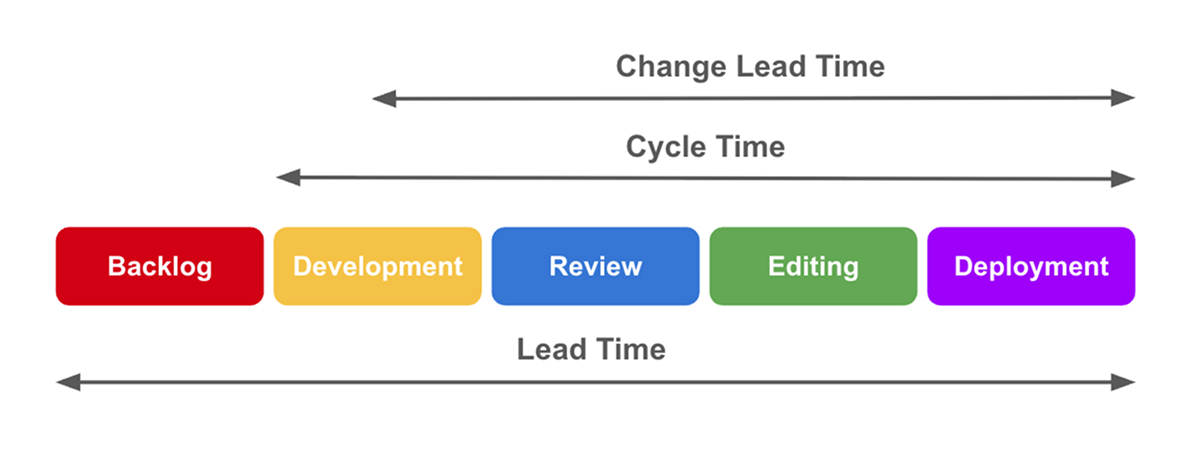
Lead time, cycle time, and change lead time may sound interchangeable; however, they focus on different parts of the SDLC. When used together, they provide a layered view of delivery performance, showing where work is getting stuck and which part of the process needs attention first.

These three metrics follow a natural sequence:

  • Lead time spans the full delivery flow from the moment work is requested until it’s in production.
  • Cycle time is a smaller window, focused only on the active development effort.
  • Change lead time is the final stretch, capturing everything that happens after code is committed.

Each metric has a different start point, but they all end at the same place: when the feature goes live.

Below is a comprehensive breakdown of the three metrics:

1. Start and End Points

  • Lead time: ticket created → feature deployed to production
  • Cycle time: work started → development complete/merge
  • Change lead time: commit → production deploy

2. What Each Metric Captures

  • Lead time: Full delivery flow, including all wait states
  • Cycle time: Hands‑on design, coding, and review effort
  • Change lead time: Post‑commit automation, deployment, in‑prod validation speed

3. Level of Focus

  • Lead time: product/request level
  • Cycle time: developer/team level
  • Change lead time: system/CI‑pipeline level

4. When to Use Each Metric

  • Lead time: Forecasting dates, pruning backlogs, guiding product trade‑offs
  • Cycle time: Spotting team bottlenecks, tuning WIP limits, improving code reviews
  • Change lead time: Benchmarking CI/CD maturity, justifying pipeline investments, accelerating safe releases

Why These Distinctions Matter

Many teams look at only one metric (mostly cycle time) and assume it tells the full story. But a short cycle time can be misleading if the ticket spent weeks in the backlog before work began. Similarly, strong developer throughput won’t help if deployments are stuck in manual reviews or unreliable pipelines.

Using all three metrics together allows you to ask smarter questions:

  • Is our backlog too long? A rising lead time with stable cycle time often means work is waiting too long before development even starts.
  • Are reviews or rework slowing us down? A jump in cycle time can reveal friction in the dev process that isn’t visible in lead time alone.
  • Is our CI/CD pipeline healthy? When change lead-time lags behind the others, it usually points to inefficiencies in build, test, or deployment automation.

Patterns to watch for

  • If lead time is high but the other two are reasonable, your issue lies in prioritization, backlog grooming, or approval cycles.
  • If cycle time is the outlier, dig into code reviews, story size, and WIP limits—it’s likely a process or execution issue within the team.
  • If change lead time stands out, the bottleneck is in your delivery pipeline. Look for slow builds, redundant tests, or manual deploy steps.

Importance of Consistency and Tooling in Measurement

Getting value from time-based metrics depends on using the same definitions and timestamps across every team and tool. If one team logs “In Progress” at design start while another logs it at first code, numbers lose meaning and comparisons break down.

Take something like lead time vs. process time; without clear boundaries, the lines blur fast, and the insights you hoped to get just don’t hold up. That’s why it’s so important to standardize definitions across your workflows. Define clear status transitions (e.g., “To Do” -> “In Progress”) and ensure all teams use them consistently.

Tooling and Measurement

  • Jira or Azure DevOps: Track ticket creation, status changes, and deployments for lead time and cycle time.
  • GitHub Actions, GitLab CI, CircleCI: Capture commit-to-production data for change lead time.
  • DORA metrics dashboards: Surface change lead time, deployment frequency, and other flow indicators.

Conclusion

Keeping lead time, cycle time, and change lead time separate shows exactly where work slows down and why. Clear boundaries cut through the noise and give you a reliable view of delivery speed. Measure each metric consistently across all tools, then focus on the one that lags. Fix it, check again, and you’ll notice a difference soon.

Written by

Sign up to our newsletter

By subscribing, you accept our Privacy Policy.

Related posts

Lead Time vs. Cycle Time vs. Change Lead Time: Main Differences
How Code Complexity Metrics Influence Your Bottom Line

Ready to Transform
Your GenAI
Investments?

Don’t leave your GenAI adoption to chance. With Milestone, you can achieve measurable ROI and maintain a competitive edge.
Website Design & Development InCreativeWeb.com