Engineering Team Metrics That Actually Drive Results in 2026
9 min read• Mar 25, 2026
Written by

Milestone Team

Engineering teams in 2026 work in a different operating environment than they did even two years ago. AI-assisted development has changed how code gets written and reviewed. Distributed teams are normal. Leadership expects a cleaner line between engineering work and business results.
That shift breaks many old habits. Tickets closed, hours logged, and lines of code never said much about value, though teams kept using them because they were easy to count. Good measurement now needs a wider view. Flow matters. Quality matters. Business impact matters. Team sustainability matters, too.
A team can close 40 tickets in a sprint and still leave customers with a slow product, a fragile release, and a burned-out review queue. The numbers look busy. The system does not improve.
The problem is not measurement itself. The problem is weak measurement. Good engineering team metrics show whether work moves cleanly, lands safely, changes user or business outcomes, and leaves the team in decent shape for the next quarter. That is a better lens than counting visible activity.
The cleanest way to think about this is through four categories:
Most software engineering team metrics worth tracking fall into one of those four buckets. The same logic applies to most engineering team performance metrics, even when the stack, domain, or team shape changes.
Flow metrics answer a simple question. How hard is it for work to move through your system?
A lot of delivery pain hides in queues. Work waits for review. Pull requests grow too large. QA becomes a bottleneck. Releases pile up behind one staff engineer who knows the deployment process better than everyone else.
Useful flow metrics include:
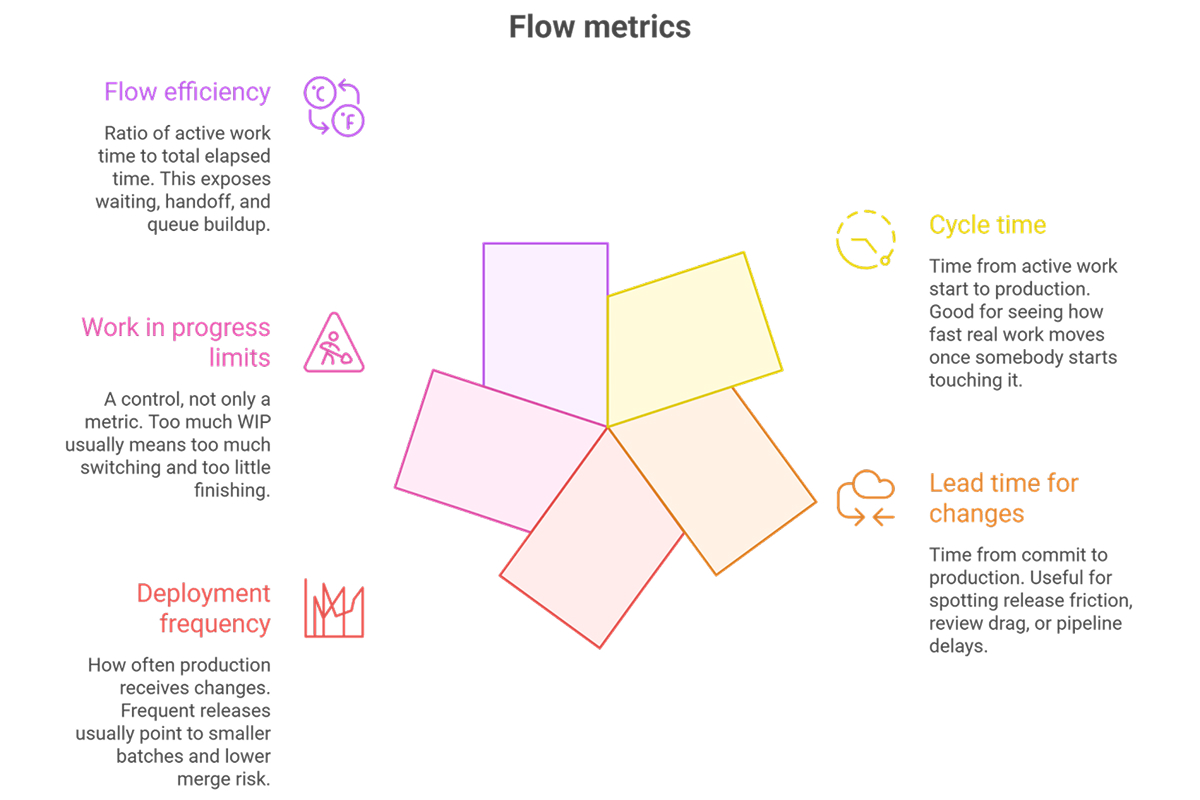
Cycle time is often where teams first see the truth. A feature estimated at three days takes twelve. Not because coding took twelve days, but because work waited in review for two, sat in QA for three, and missed a release train. Once that pattern becomes visible, the conversation changes. Teams stop arguing about individual effort and start fixing the system.
A useful habit here is slicing by work type. Bug fixes, customer-facing features, platform work, and migration tasks behave differently. One blended median hides too much.
Speed without quality does not stay fast for long. Teams that ship unstable work usually pay for it in later sprints, during incidents, and when roadmap work slips because time is spent cleaning up rushed releases. Reliability metrics matter because they connect delivery speed to production reality.
Useful quality and reliability metrics include:
A mature team does not chase a perfect change failure rate on its own. That often creates fear-driven release behavior, where teams batch changes, delay deploys, or avoid necessary risk. Trend analysis is more useful. If deployment frequency rises while change failure rate stays stable, that is healthy. If deployments stay fast but recovery time keeps increasing, resilience work is overdue.
This is the category engineering teams often skip because the signal feels less direct. A pull request has a clear timestamp. Feature adoption or revenue impact is harder to measure. That does not make business outcome optional.
If leaders only review flow and reliability, they learn whether delivery is efficient, not whether it matters. A team can build the wrong thing efficiently for months.
Useful business impact metrics include:
This does not mean every team needs a dollar figure on every story, because real systems are rarely that tidy. Still, quarterly planning should create a clear link between technical work and the outcome. A platform team might track deployment lead time, a backend team might measure failed checkout retries, and a data platform team might follow analyst wait time. The main point is simple. Engineering output alone is not the finish line. What matters is the effect that work has on users and the business.
Teams do not stay effective by accident. They stay effective when the working environment protects focus, keeps review loops short, spreads knowledge, and avoids chronic overload.
Useful team health metrics include:
These metrics should stay at the team level. Once leaders start using them as individual ranking tools, data quality collapses. People adapt fast. Reviews become shallow but quick. Meetings disappear from calendars while chat interruptions go up. Nobody wins.
The phrase “data engineering team metrics” often gets lumped in with standard delivery dashboards. That usually leads to the wrong conclusions. Application teams and data teams share some signals, though the work shape is not the same.
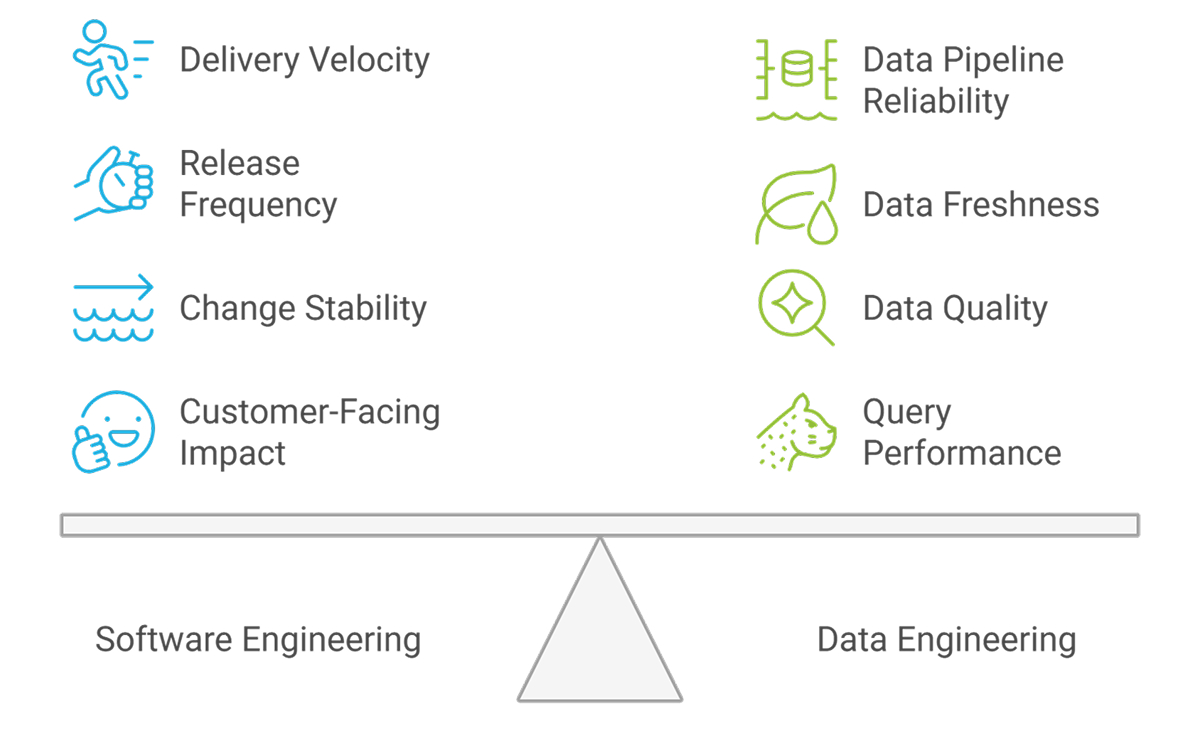
Application teams live closer to the user surface. Feature speed, release quality, and production reliability usually dominate.
A product squad missing a weekly release is painful. A data platform missing freshness targets during finance close or model retraining is a different kind of pain. The metric system should align with the team’s actual responsibilities, not a generic template.
Remote work does not need activity monitoring. Remote work needs friction monitoring.
The key metrics for remote engineering teams are the ones that expose coordination drag without punishing autonomy. Review time matters more when half the team sleeps during the other half’s workday. Documentation quality matters more when hallway clarification is no longer available. Ownership clarity matters more when nobody sits near the person who built the service two years ago.
Useful remote signals include:
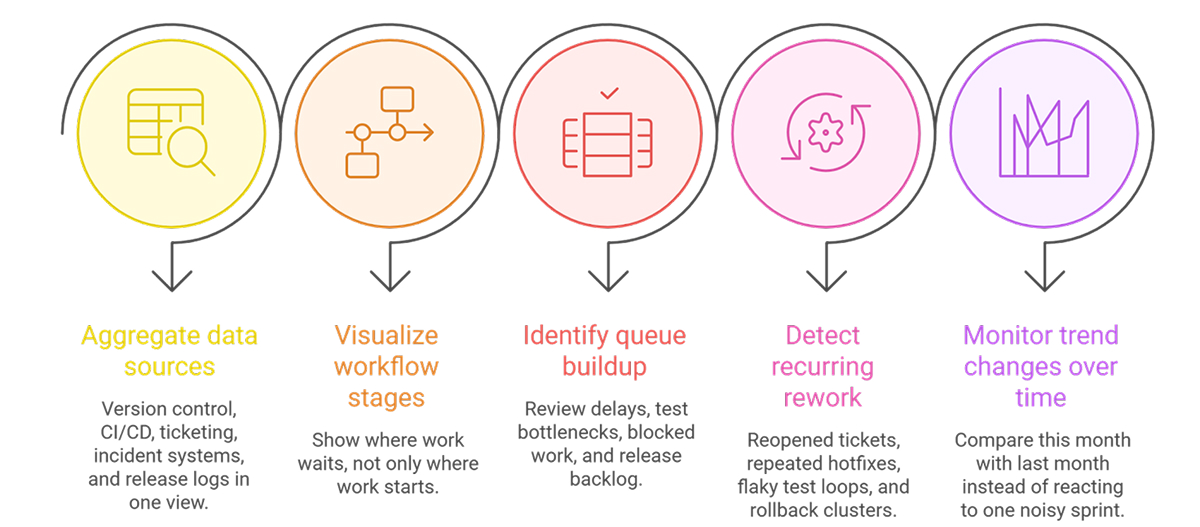
Tools matter because raw system data is scattered across multiple systems. Commit history sits in version control. Build results sit in CI. Incident data sits somewhere else. Ticket state changes live in the tracker. Without aggregation, teams end up reading fragments.
Good tools help teams do five things:
The danger starts when a dashboard becomes a compliance tool. Teams stop trusting the numbers. Leaders start reading movement as intent. The best tooling supports diagnosis, retrospectives, and roadmap adjustment. Surveillance ruins all three.
Metrics only help when tied to planning and review cycles. A team running a quarterly reliability objective should not wait six months to decide whether the work helped. At the same time, changing the whole dashboard every two weeks creates noise.
A practical rhythm looks like this:
Common mistakes show up fast:
The cleanest metric systems stay small. Teams do not need thirty charts. They need a handful of signals that match current priorities and a habit of reading them honestly.
The best engineering metrics systems in 2026 are not bigger. They are more focused, more practical, and more closely tied to how teams actually create value. They help teams move work with less friction, ship with less risk, connect engineering effort to meaningful business outcomes, and protect the conditions that support steady, sustainable performance over time. Good metrics do not just describe activity. They help teams see what needs attention, what is improving, and where work is creating real results.
Start with flow, reliability, business outcome, and team health. A practical baseline includes cycle time, deployment frequency, change failure rate, mean time to recovery, feature adoption, and review turnaround time. Those cover delivery speed, release safety, value, and sustainability without drifting into vanity tracking.
They pull signals from source control, CI/CD, ticketing, and incident systems into one view. That makes waiting visible. Review queues, flaky test loops, blocked tickets, and release backlogs stop hiding inside separate tools. Trend views also help teams distinguish between a bad week and a real system problem.
Metrics for teams support decisions about work. Metrics about teams often turn into observation without action. Cycle time, failure rate, and handoff delay help improve the system. Hours online or message count mostly describe visible activity and often push teams toward shallow, defensive behavior.
Managers usually combine engineering intelligence tools, ticketing data, review analytics, incident records, calendar patterns, and short pulse surveys. No single dashboard tells the whole story. The useful setup mixes workflow data with signs of overload, review debt, meeting pressure, and repeated interrupt-driven work.
Quarterly planning still works best for direction. Monthly review works better for correction. Most teams need both. Set outcome targets by quarter, then inspect trends each month and adjust scope, sequencing, or support work when signals show drift, risk, or a mismatch between planned value and delivery reality.
Sign up to our newsletter
By subscribing, you accept our Privacy Policy.