How to Handle the Engineering Visibility Gap in SDLC
8 min read• Mar 18, 2026
Written by

Milestone Team

Engineering teams generate a lot of data while they build software. These include tickets moving across a board, pull requests getting reviewed, CI pipelines passing or failing, deployments, and more. But most of the time, the data is scattered across tools and never yields a clear picture to support decision-making.
This makes it difficult to answer questions such as:
This is considered the engineering visibility gap, the difference between what your SDLC is doing and what people think it’s doing based on snapshots, meetings, or gut feelings.
In this article, we’ll look into where visibility breaks, what it costs, and practical ways to close the gap with simple metrics, better workflow signals, and lightweight habits that scale.
When teams say, “We need better visibility,” leadership’s first instinct is to create a dashboard. Dashboards can help, but the root problem is usually simpler. The workflow data likely exists, but it’s fragmented, inconsistent, and difficult to trust.
Most engineering teams build their toolchain from the ground up. They accumulate it over time, using different third-party tools for different purposes. These could range from using Jira and ClickUp for product planning to GitHub for source control, to CI/CD platforms like GitHub Actions and Jenkins. As a result, data is scattered across different systems, making it difficult to derive meaningful insights into software development workflows and their effectiveness.
If you are a developer, you have probably seen tickets on a project board marked as in progress, with a pull request sent for the ticket. Also, the build pipeline is already completed.
But nobody can quickly answer:
This is where engineering team visibility breaks down: you can see activity across different systems, but are unable to gather useful information.
In the software development lifecycle, “development time” usually takes prominence. But, if you only measure it as a metric, it will hide quiet delays where the work is waiting in review, delays in CI runs, and work getting stuck in QA. Those waits are invisible unless you collect signals from the entire workflow.
Then, you can analyze these signals to identify bottlenecks and reduce lead time, thereby improving overall delivery.
Weekly updates are not evil. But when updates become the system, where all the stakeholders get in sync, people start optimizing for the update. They may write updates like “Doing research on X factors impacting the development task,” which is important, but is it really big enough to report? These doubts exist. Therefore, it’s important to establish common ground for reporting updates.
For example, it’s common to state whether development has started, a brief on progress made, any blockers, and, if the person is ending their development, which tasks they will pick up.
That’s why development workflow transparency needs to be systemic, not dependent on who writes the best update.
However, lack of visibility rarely causes a dramatic failure on day one. It usually shows up as a slow, expensive drift. When leaders can’t see flow, they plan based on optimism. Then reality hits:
Research-backed delivery metrics exist for a reason. DORA’s guidance emphasizes outcome-oriented measures (like lead time and deployment frequency) and links them to organizational performance and team well-being. Without reliable signals, planning becomes either overconfident (“We can do it, sure.”), or over-defensive (“Add padding and buffers everywhere.”). Both hurt where overconfidence breaks trust and over-padding slows the business and frustrates engineers.
When you don’t see early risk, you find out late, and leadership decisions become reactive. This is where engineering analytics visibility matters. You need leading indicators, not just retrospectives.
What you lose when visibility is weak

There are many signals that you can use to identify visibility gaps in your SDLC.
If the only way to understand delivery is through recurring meetings, it indicates you don’t have full, systematic visibility. Meetings are fine for alignment, but they shouldn’t be the place where truth is constructed. If a sprint review is the first time anyone realizes work is blocked, the system isn’t surfacing blockers early enough.
A healthy workflow has motion, with different activities happening at each stage of the lifecycle. Sometimes, development is in progress, or the PR is being reviewed, waiting for the build to run, etc.
If items sit “in progress” without a clear reason, the system is hiding the why. This often points to unseen queues (review load, flaky tests, environment access, unclear ownership). This doesn’t mean you have to include a column in your project board for every activity. You can define the useful ones. Still, if you define one for “In progress”, this should mean active movement (someone is working on it), not just waiting with a label on the board.
When teams stop being surprised when actual work deviates from the estimate, that’s a smell. It usually means estimates are being used as promises, not forecasts. Variance is normal in software, but if you can’t explain the variance (e.g., dependency risk, unclear scope, review delays, and production interruptions), then you’re missing the signals that would let you plan realistically.
When a leader pings individuals for updates, they’re compensating for missing system-level signals. It also creates two realities: one in private threads and one in public tools. Over time, that pattern punishes transparency because the “real status” becomes a private conversation.
You can improve one part (like CI speed) and still feel stuck because the bottleneck moved elsewhere. That’s a classic flow visibility problem. Without end-to-end signals, teams keep fixing the loudest pain point rather than the true constraint.
A practical visibility hook example
If you want visibility without new tools, start by emitting consistent events from CI. Even a lightweight JSON log helps.
{
  "service": "billing-api",
  "commit": "a1b2c3d",
  "pipeline": "main",
  "stage": "tests",
  "result": "pass",
  "duration_seconds": 412,
  "timestamp": "2026-02-02T10:14:00Z"
}
If every repo emits something like this, you can build cross-team visibility later without rewriting workflows first.
You don’t fix visibility by demanding more updates. You fix it by making the workflow fundamentally observable.
Here’s a path that works in real organizations without turning them into metrics factories.
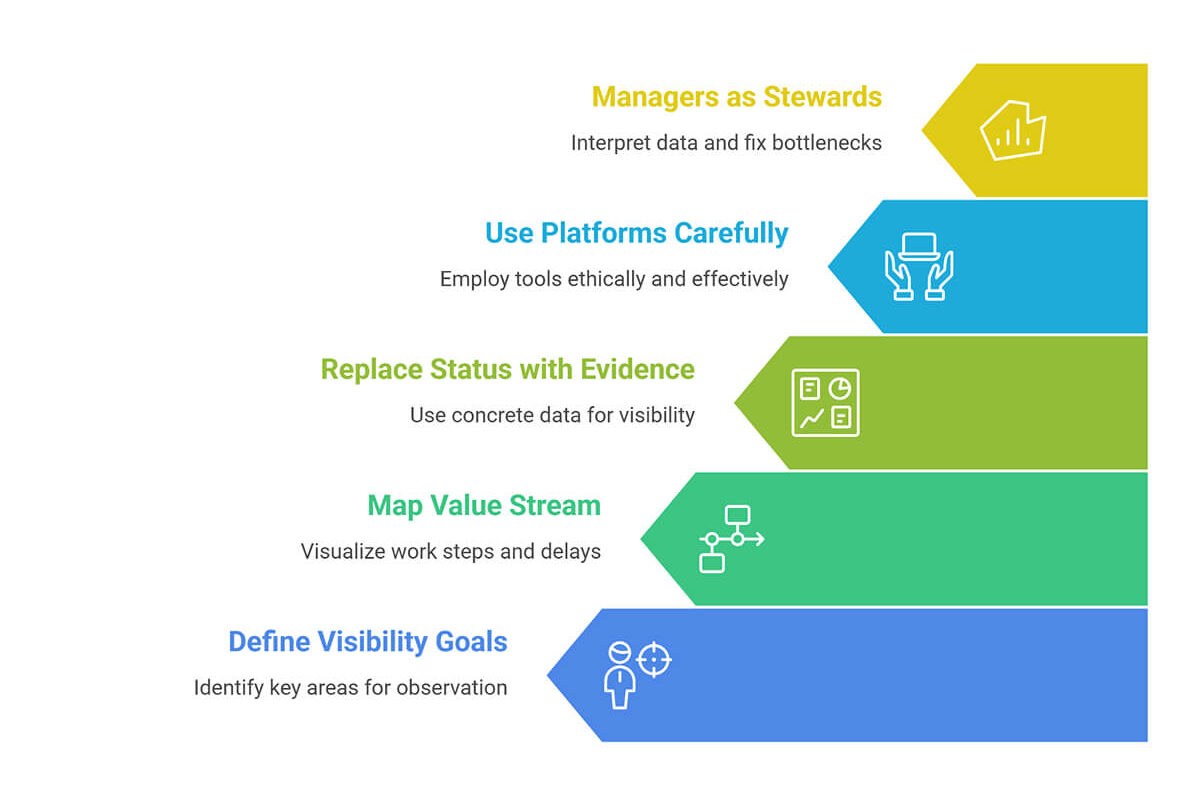
Start with three questions:
Avoid the temptation to measure everything. It backfires. Extra metrics create noise, and teams stop trusting the system. A helpful trick is to define a small core set first and treat everything else as optional until the core signals are stable. A useful pairing:
Also, write one sentence about intent, such as: “These metrics exist to identify bottlenecks and reduce risk, not to evaluate individual performance.” That line alone prevents a lot of misuse later.
Value stream mapping sounds enterprise-like, but the idea is simple: map the steps and identify the waits. Most teams find that the biggest delays aren’t coding; they’re handoffs, queues, and rework.
Your first map should show where work enters, waits, is reviewed, tested, deployed, and monitored.
This is where you improve SDLC visibility without adding an explicit reporting activity. A set of good evidence signals includes PR aging and review time, build duration and failure rate, test flakiness rate, and deployment frequency.
Modern “software intelligence” and analytics platforms can stitch together tool data into a coherent view, especially when you have many teams. The best ones reduce manual reporting and surface bottlenecks early. But here’s the rule that keeps trust intact: If a metric will be used to rank individuals, don’t collect it-people will game it, and you’ll lose the signal.
A good middle ground is to focus on team-level trends (month-over-month direction) rather than daily spikes. That keeps the conversation focused on improvement, not blame.
It’s also important to understand that tools can reveal patterns, and that managers can explain them. A manager’s role in visibility is not to “monitor.” It’s to validate data quality, connect signals to context, fix system bottlenecks, and protect psychological safety around measurement.
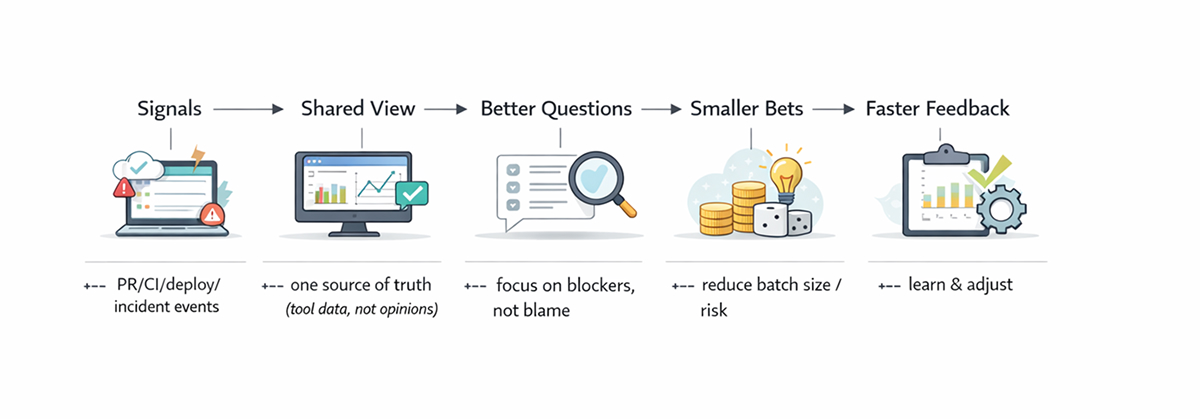
A practical habit is to treat poor metrics like a bug report. Start by asking, “What changed in the system?” rather than “Who caused this?” That keeps the data honest and helps teams surface real constraints.
If you want a broader perspective on leadership behaviors that make teams resilient (not monitored), this article on technical leadership principles connects well with the visibility discussion.
Closing the visibility gap is less about watching people and more about watching flow. If your organization is growing, you can’t rely on proximity and intuition. Build visibility into the workflow by mapping the stream, standardizing signals, and treating metrics as a learning tool. When the system tells the truth, planning becomes calmer, incidents are less chaotic, and teams spend more time delivering value rather than explaining what happened.
Look for:
It increases variance. Plans are built on assumptions, not flow data. Without consistent delivery signals (such as lead time, deployment frequency, and failure recovery), you either overpromise or pad everything.
Yes, normally. Start by standardizing events and definitions across existing tools (PR states, pipeline stages, deploy markers). Many teams get a big lift from instrumenting what they already have and making it searchable and consistent.
They keep measurements honest and useful by:
A single dashboard rarely fits all; shared signals should exist, but views should be role-aware.
Sign up to our newsletter
By subscribing, you accept our Privacy Policy.