
Software engineering is an iterative process of planning, delivering, and learning. In addition to development, this process involves many stakeholders, meetings, and documents to ensure that the end results meet the expectations of everyone.
The velocity report is a simple document in this mix that helps development teams calibrate expectations, stabilize delivery, and guide improvement. This guide is designed for engineers and engineering leaders who want a clear and practical approach to understanding, interpreting, and acting on engineering velocity.
What Is a Velocity Report?
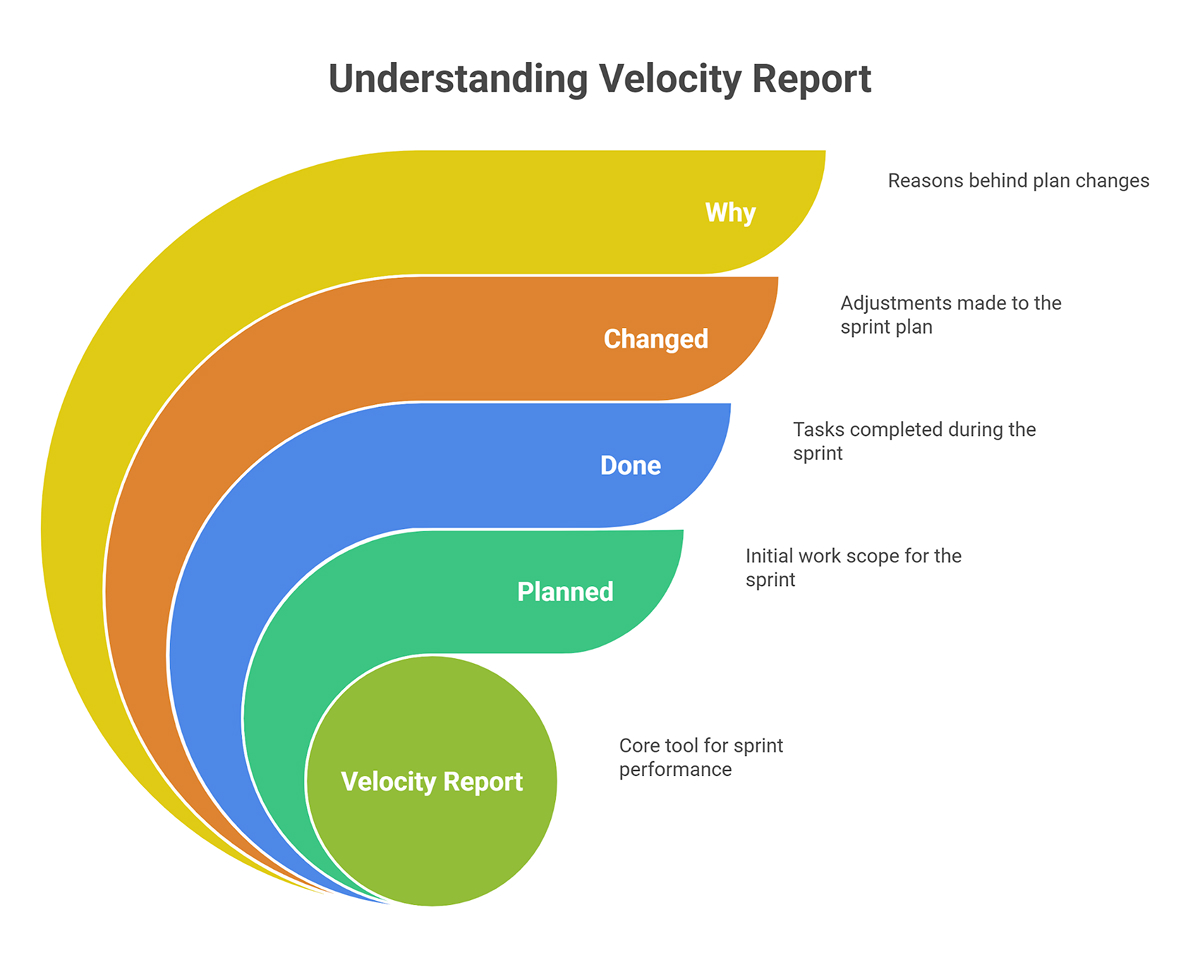
A velocity report summarizes the amount of work a team completed within a fixed timebox (usually a sprint). Most teams measure work in story points, while others rely on item throughput (the count of issues completed) or cycle time. Whatever the unit, the goal is the same: show what was planned, what got done, what changed, and why.
What are the Questions that a Velocity Report Answers?
1. What are our intended deliverables?
- The items or points that the team planned at the start of the sprint. Consider this the baseline commitment.
2. What outcomes have we achieved?
- The items or points that met the team’s Definition of Done (DoD) by the end of the sprint.
3. What modifications have been made?
- Scope added or removed after the sprint began, like urgent work, de-scoped tickets, or items split and re-estimated.
4. What prevented us from advancing?
- The qualitative context includes things like incidents, delays in receiving help, environmental failures, staff changes, and unplanned breaks.
Inputs of the Velocity Report
Start with completed work: story points or items that truly crossed the DoD, including tests, code review, documentation, and deployment, as your team defines them. If a ticket is only 80% complete, count it as zero for this sprint and attribute it to the next sprint when it actually meets the DoD.
Next, add carried-over items, which are tasks that must be completed in the next sprint. These are good signs that the stories might be too big or that they started too late.
To keep track of changes in scope, write down tickets added during a sprint (such as a security patch) or removed because they were deemed less important. Make sure to record both the number and size of the tickets so you can measure their effect.
Add quality signals such as escaped defects, rework items, hotfixes, change failure rate, and MTTR to show the “cost of speed” that raw velocity numbers can hide.
Outputs of a Velocity Report
Outputs of a Velocity Report convert raw sprint data into a clear snapshot of what was delivered, how it compared to the plan, and what that implies for the next sprint.
1. Sprint velocity
- Report the total completed work per sprint (e.g., 38 points).
- If you track throughput, also show items completed in the sprint.
2. Completion ratio
- Formula: completed / committed.
- Example: 38 / 42 = 90%.
- Helps assess sprint planning accuracy.
3. Recent range (variance)
- Show a small range over the last five sprints to reflect normal fluctuation.
- Example: Our recent completion typically falls between 35 and 40 points.
4. Predictability
- Indicate how closely plans match outcomes across multiple sprints.
- Use a simple band (e.g., 35-40 points) rather than a single number.
5. Short narrative (2-4 lines)
- Connect numbers to causes and next actions.
- Example: “An outage diverted 5 points to incident response; next sprint we’ll add an alerting guardrail and cap mid-sprint scope at 10%.”
Understanding the Velocity Chart
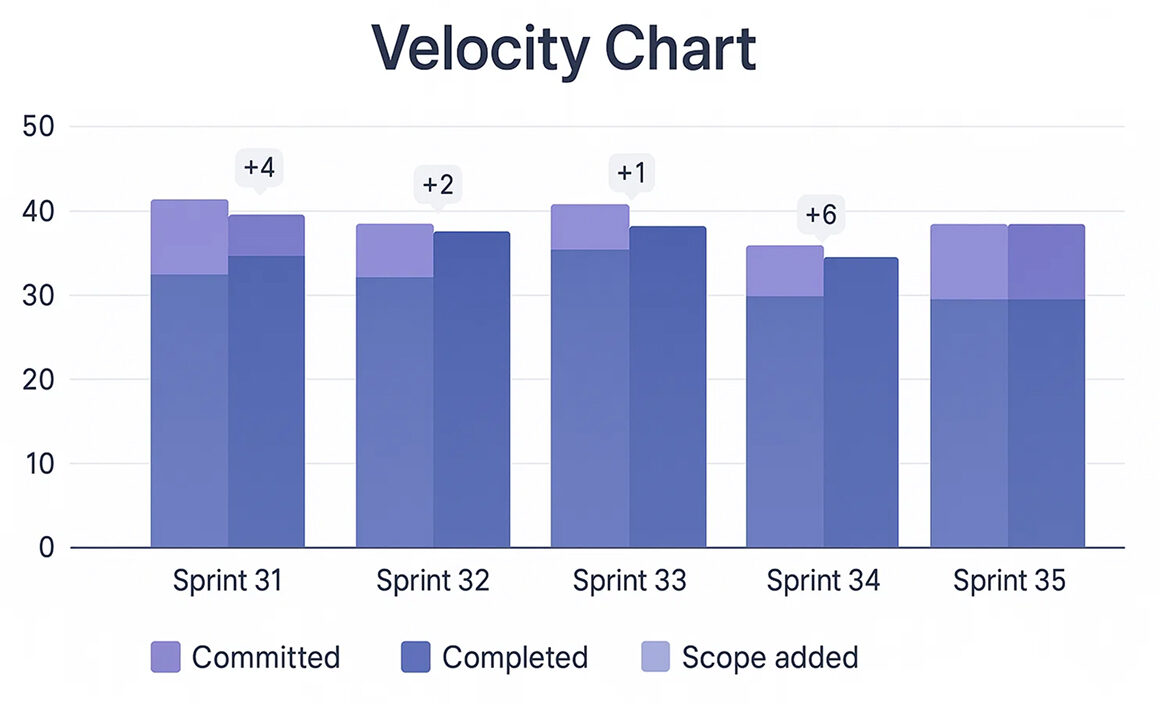
A velocity chart is a bar chart with one column for each sprint along the horizontal axis. For every sprint, you’ll see two colored columns (or two colored segments in the same column):
- Committed (what the team planned)
- Completed (what the team finished)
Some tools also show the scope added mid-sprint. Read it left-to-right and ask three questions:
- Consistency: Are completed bars relatively stable?
- Calibration: Is commitment close to completion?
- Change load: How often is the scope added or removed during sprints?
Analyzing Velocity Trends Over Time
A good output of a Velocity Report should show what you finished, how closely it matched the plan, how that compares to recent sprints, and what the numbers imply for the next sprint.
Use these simple, repeatable methods to separate signal from noise:
1. Rolling average (last five sprints).
- What it is: the mean of the last five completed sprints.
- Why it helps: It smooths out single-sprint spikes, allowing you to plan around typical capacity.
- How to do it: add the last five completed velocities and divide by five.
2. Prediction interval (range, not a point).
- What it is: a realistic band around your rolling average showing likely outcomes (e.g., 35-40 points).
- Why it helps: stakeholders plan to a range, not a fantasy number.
- How to do it: compute the standard deviation (σ) of the last five velocities and state your forecast as a rolling average ± σ (rounded to whole points).
3. Seasonality & event annotations.
- What it is: markers on your chart for holidays, releases, significant incidents, on-call rotations, and team changes.
- Why it helps: explains dips and spikes without guesswork.
- How to do it: keep a tiny “events” log and place icons/notes on the timeline each sprint.
Use a compact table to pair the numbers with context:
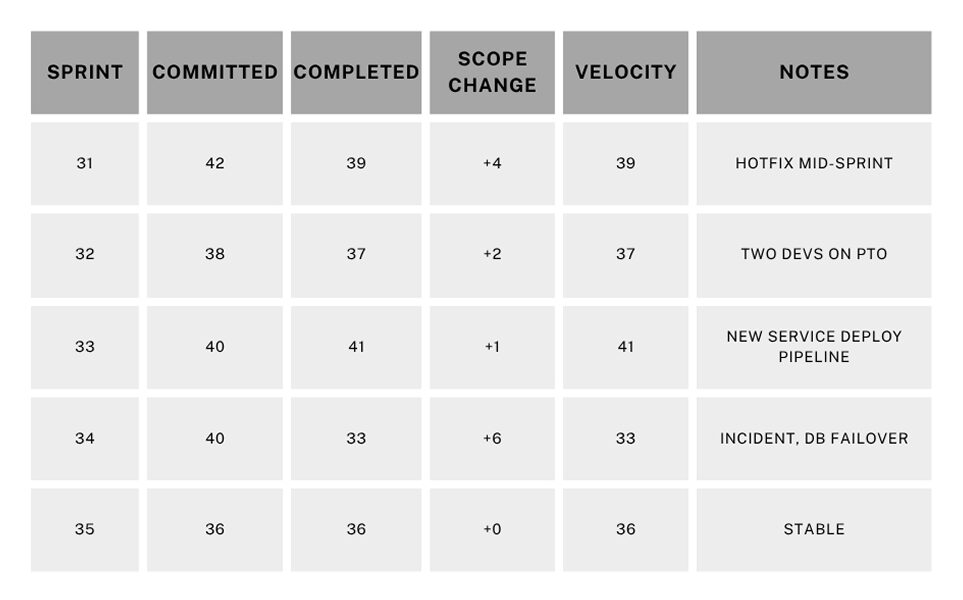
Reading it: Sprint 34 dipped due to an incident; otherwise, the team’s completion clusters around 36-41 points. Forecast 35-40, not a precise single number.
Velocity Tracking Best Practices
Keep velocity tracking consistent and straightforward so it runs the same way every sprint. Aim for low-effort rituals that capture the essentials without adding overhead.
1. Protect Definition of Done
- Include tests, reviews, docs, and deployment.
- Do not count half-done work.
- If something spills, split it and only count the completed slice.
2. Stabilize Estimation
- Use relative story points with reference stories (e.g., our 3-point story = a trivial backend change).
- Avoid re-estimating mid-sprint unless you genuinely split scope.
3. Control WIP
- Limit in-progress items per dev/pair.
- Finish small things continuously. Start less, finish more.
4. Separate Planned vs. Unplanned Work
- Use a dedicated swimlane or labeled section for unplanned work (production incidents, security mandates, urgent requests) so it’s separate from planned scope, and its impact on capacity is clear.
- Track the hit rate each sprint (e.g., Unplanned consumed 20% this sprint).
5. Connect Velocity to Flow and Quality
- Pair velocity with cycle time and change failure rate.
- A healthy system delivers predictably, with a short lead time and low failure rate.
6. Make It Visible
- Keep your chart and notes in the sprint review deck.
- Highlight outliers with context. When a sprint is unusually high or low, add a short note directly on the chart.
Common Mistakes and Misconceptions
- Taking velocity as an individual KPI: Velocity is a team metric, not an individual one. Individualizing it will make sandbagging and cherry-picking easy work.
- Cross-team comparisons: Different domains, tech stacks, and estimation baselines make numbers incomparable.
- Earning points before completion: Points reflect the value delivered, not the time.
- Estimates inflation to look faster: Stakeholders will feel the mismatch between your reports and outcomes.
Forecasting from Velocity (Without Over-Promising)
1. Predict a range, not just one number
- Take the last five sprints that were finished, find the average and the usual spread, and then say your prediction as a band.
- If the most recent speeds are 39, 37, 41, 33, and 36, the average is about 37, and the typical spread is about ±3.
- This means that the next sprint will be between 35 and 40 points.
2. Be clear about your assumptions
- Write one sentence that ties together capacity and interruptions so that everyone knows what needs to stay true.
- This forecast is based on the same number of people on the team, no major production problems, and the same amount of on-call work.
3. Show a simple sensitivity
- Give one “what if” that cuts back on capacity to account for realistic interruptions.
- If we hit two critical interrupts, expect ~30-32 points; with a full team and no interrupts, we’ll likely stay near 35-40.
When stakeholders hear the range and assumptions early, trust increases, even if a future sprint falls short. You already explained the variance model.
Bringing AI and Automation Into the Loop
Automation is especially useful for cleaning up data, detecting trends, reducing manual labor, and improving the consistency, accuracy, and timeliness of your velocity reports.
- Data validation bots: Ensure story points exist and statuses are valid before a sprint closes.
- Change detection: Send an alert when the amount of scope added during a sprint exceeds a certain threshold.
- Anomaly flags: Identify velocity outliers and link them to deployment frequency or incident counts.
- Notes that are done automatically: write the sprint narrative from the events, then have a person edit it (a very important step!).
Keep people informed so they can make informed decisions and understand what’s happening. Automation should make work easier, not take over the story.
FAQs
1. How can velocity reports be combined with other engineering metrics for deeper insights?
Combine velocity with DORA and flow metrics to see both volume and health. For example, if velocity is steady but lead time keeps improving, you’re delivering the same volume faster, which is a strong signal.
Conversely, if the change failure rate rises while the velocity rises, you’ve likely over-optimized for output at the expense of quality.
2. What are the risks of using velocity reports for performance evaluation?
Using velocity as a performance metric encourages gaming the system, resulting in larger estimates, cherry-picked easy tasks, and under-scoped work, which ultimately reduces predictability. Treat velocity as a planning tool, not a grading tool.
3. How often should teams revisit their velocity tracking methods or tools?
Review them quarterly as a baseline, and re-evaluate immediately after significant changes, such as a process overhaul, platform migration, or team reorganization.
4. Can AI or automation improve the accuracy of velocity reporting?
Yes, by enforcing data completeness, spotting anomalies, and summarizing patterns. But accuracy still hinges on process discipline: a crisp DoD, stable estimation references, and consistent workflow transitions.
5. What are common misconceptions about velocity reports in agile organizations?
- Higher velocity always means better performance.
- Velocity can compare teams.
- Velocity is sufficient on its own.
Conclusion
Velocity is a planning tool, not a trophy. Use it as a real mirror to show what you did, what changed, and how the quality stayed the same. To get the whole picture, add flow and reliability metrics to it.
After a few sprints, you can see patterns in how much you usually deliver, what gets in your way the most, and what a realistic forecast looks like. Those insights help you make more effective promises and maintain a calm demeanor when you deliver.
Put more value on predictability than speed, steady progress than spikes, and quality than point-chasing. Your team and the people who care about your project will notice the change.