Modern engineering teams are shipping AI into production at record speed. But speed without measurement turns into guesswork: models degrade, costs creep up, and it’s hard to prove business impact. A well-designed framework gives you a shared language and system to track usage, quality, risk, and ROI, and to decide what to fix next.
This article is a step-by-step, engineering-first guide to building that framework in the real world, from defining meaningful metrics to automating evaluation loops and aligning technical outcomes with business goals.
Step 1 - Define Strategic Goals and Scope

Your AI measurement framework exists to move the business forward. So, every AI performance measure it collects must be traceable back to a concrete objective. For example,
- Business goal: Reduce mean handling time for support tickets by 20% this quarter.
- Measure deflection rate, time-to-resolution, and accuracy of AI-to-human hand-offs.
- Product goal: Increase doc search satisfaction (CSAT) to 4.4+.
- Track search reformulations, click-through quality, explicit thumbs-up feedback, and session success rate.
- Technical goal: Cut p95 latency to <700ms while staying under $X per 1k tokens.
- Focus on latency, timeouts, and cost per successful request-exclude batch jobs.
Step 2 - Establish Measurement Domains & Categories
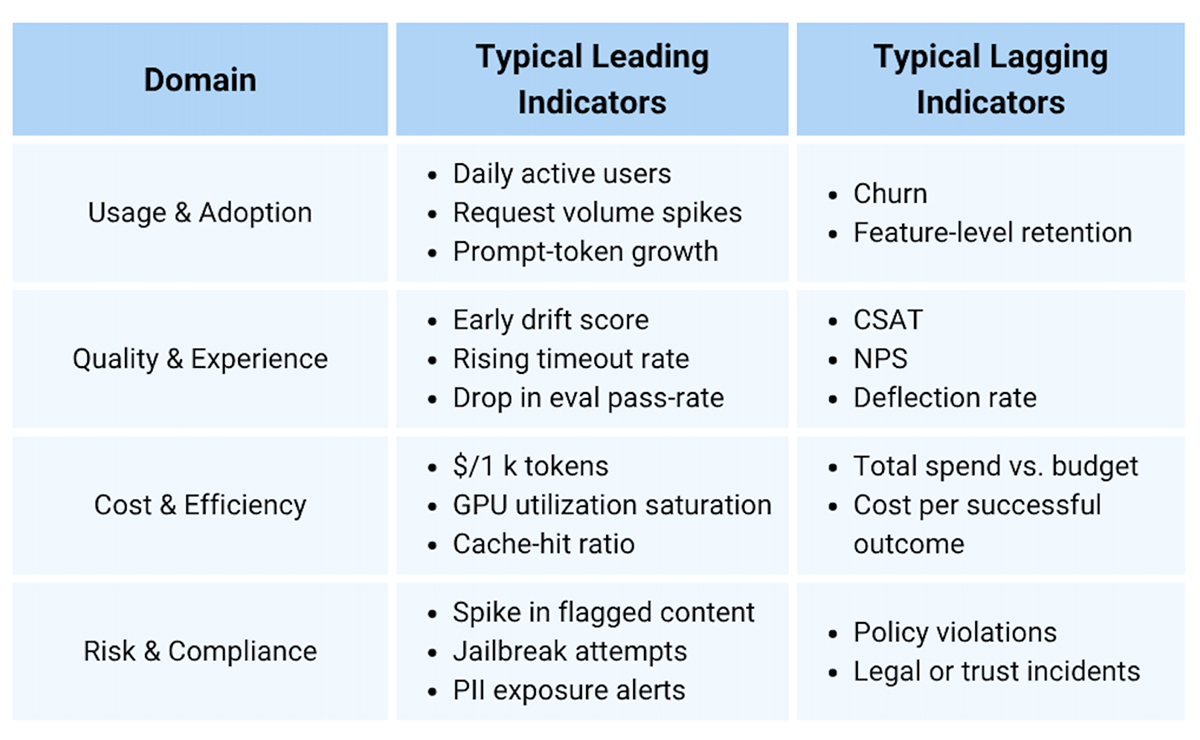
Cover the entire system without getting overwhelmed by numbers. Organize metrics into four high-level domains and pick a small set of leading and lagging indicators.
- Leading indicators (e.g., early drift, rising timeout rate) give you time to react.
- Lagging indicators (e.g., churn) confirm whether the system helped or hurt.
Step 3 - Select and Define Metrics/KPIs (Precisely)
A metric is only useful if everyone can compute it the same way. Use this single-page “blueprint” whenever you create or update a metric.
- Name: “Answer Helpfulness@Top1”
- Definition: % of model answers rated “helpful” (thumbs up or 4–5 CSAT) on first response, excluding retries.
- Formula: helpful_first_responses / total_first_responses
- Unit: percent
- Target/threshold: ≥ 65% target, alert if 7-day avg < 55%
- Owner: Product AI lead
- Frequency: real-time alerting + weekly review
Step 4 - Instrumentation & Data Collection
If you don’t collect good data on every AI request, all later metrics are useless. So, set up logging once and do it right.
Log one Clean Record for Every Request
- request_id, user_id (hashed), session_id
- Timestamps for request, tool calls, model output, and post-processing
- Prompt/response hashes (not raw text in PII-sensitive flows)
- Token counts, latency per component
- Model metadata for provider, model version, temperature, top-p
- Outcome signals for user feedback, click outcomes, handoff flags, business event IDs
Golden rule: Link inference events to business events (order created, ticket closed, doc viewed). That’s how you prove impact.
Respect Privacy and Compliance
- Hash or pseudonymize all user identifiers.
- Tag logs by sensitivity: keep raw PII only where absolutely needed.
- Automatically delete old raw data (e.g., retain for 30 days, then aggregate).
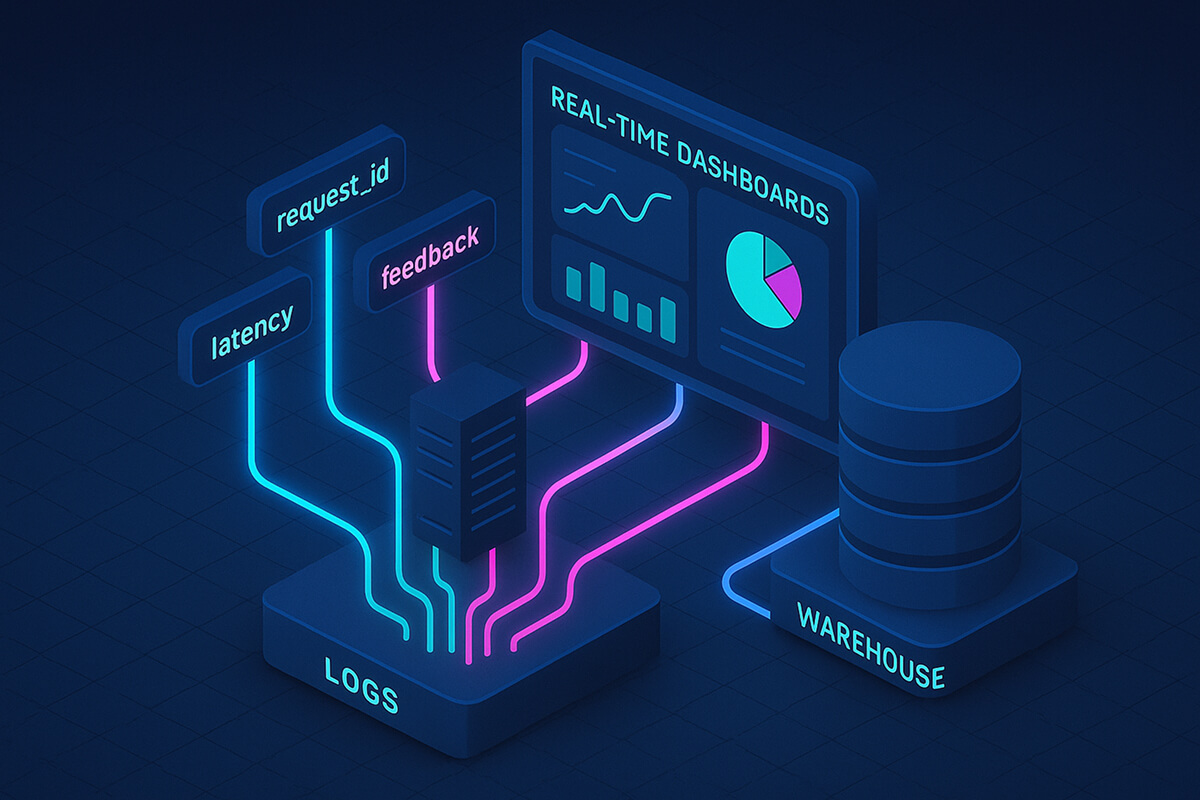
Store Data in Two Layers
- Real-time store: Live dashboards & alerts (seconds)
- Warehouse: Heavy analysis & joins (hours)
Process data in two ways
- Online guardrails: real-time rules that block or alert on bad output.
- Offline batch jobs: deeper evaluations (e.g., weekly quality scoring).
Step 5 - Governance, Review Loops & Continuous Monitoring
Monitoring is not about taking a weekly screenshot. It’s a contract: who watches what, how often, and what happens when something breaks.
Define Ownership and Cadences
- Daily on-call: latency SLOs, error spikes, provider incidents.
- Weekly review: KPI trends (helpfulness, deflection, cost per outcome).
- Monthly council: model changes, drift reports, bias audits, policy exceptions.
Alerts that Matter
- Health: p95 latency, error rate, tool timeout rate.
- Cost: $/1k tokens, $/successful outcome, total spend vs. budget.
- Quality: eval score dips, spike in jailbreak attempts, surge in human handoffs.
Change Management
- All model changes go through gated releases (shadow, A/B).
- Attach a model card (including version, training data summary, evaluations, and known limits).
- Rollback playbooks are written before deployment, not after the page.
Step 6 - Visualization, Reporting & Stakeholder Communication
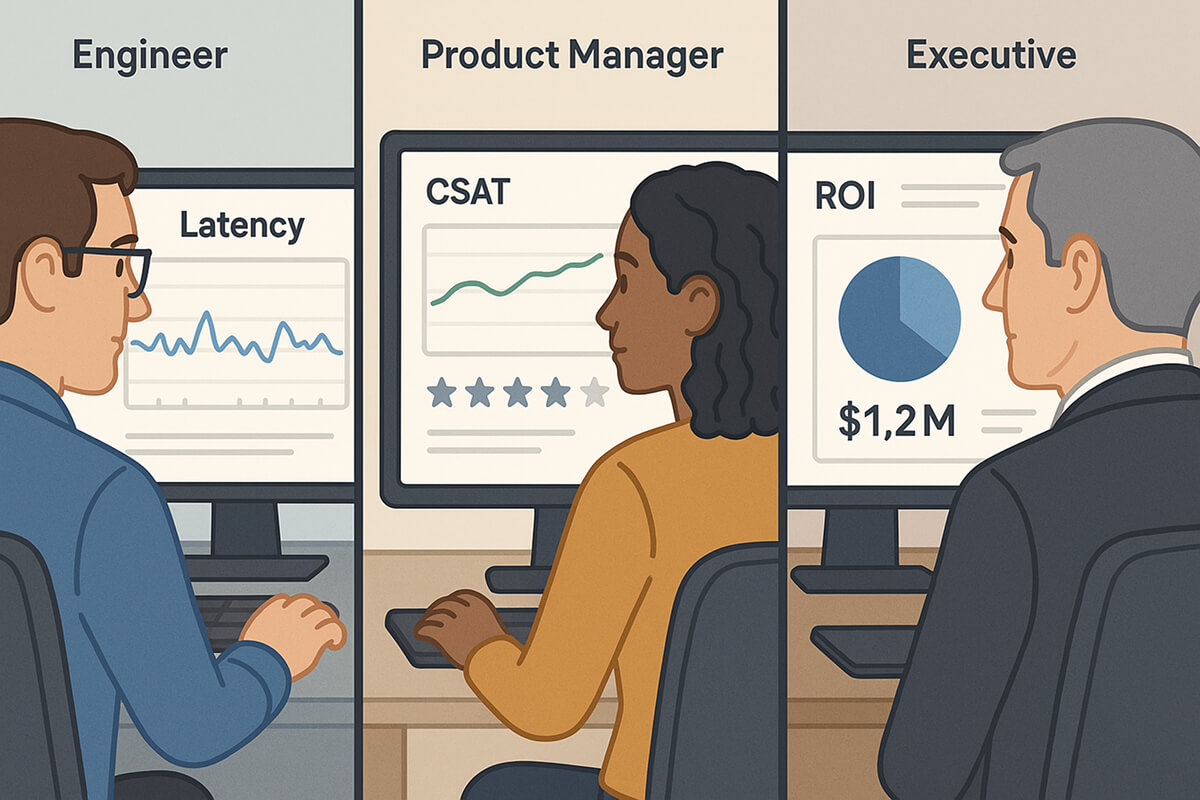
Once you have good data (Steps 4-5), you must show it in a way each group can understand and use. Executives, product managers, and engineers care about different things, but have different views for different purposes.
Dashboard Anatomy
- Top band (everyone): status of health/quality/cost-green/yellow/red.
- Engineering page: latency, error taxonomy, tool-call heatmaps, queue depth.
- Product/Ops page: session success, reformulations, handoff patterns, CSAT.
- Executive page: outcomes per dollar, revenue lift, deflection savings, risk posture.
Design Guidelines
- Less is more: 6-8 tiles per page max.
- Comparisons: show delta vs. last week and vs. target.
- Annotations: add release notes or incident markers to charts.
- Narrative: a 5-sentence weekly write-up beats a 15-chart carousel.
Step 7 - Continuous Improvement & Iteration
Your measurement stack is never “finished.” Treat it like any other product: review it regularly, add features that enhance it, and remove elements that no longer add value.
- Close the loop: feed weekly insights back into prompts, retrieval rules, and tool selection.
- Evolve evaluations: add new checks as needs grow (e.g., a hallucination detector when ingesting a new document set).
- A/B testing: change one variable at a time, plan the sample size, and decide success before you start.
- Retire stale metrics: if a metric never changes decisions, archive it.
Common Challenges and How to Beat Them
1. Data Silos and Metric Ambiguity
Teams compare numbers and realize their “deflection rate” or “helpfulness” values don’t match.
Why it happens
- Every team writes its own SQL.
- Metric names live in slide decks, not in code.
- Formulas drift over time. One group divides by all sessions, another by human-escalated sessions.
How to fix it
- Publish a “metrics catalogue.” Create one YAML/JSON file per metric with the following details: name, formula, owner, dimensions, and good/alert thresholds.
- Store it in Git. Treat changes as pull requests reviewed by data + product leads.
- Validate in CI. Add a test that runs the official query against staging data and fails the build if the result changes unexpectedly.
- Link dashboards to the catalogue. Dashboards should import metric definitions, not duplicate SQL.
2. Resistance to Change
Engineers glaze over dozens of graphs; execs complain they “can’t see the story.”
Why it happens
- Dashboards grew organically; nobody pruned them.
- Technical charts show up in exec reviews; revenue charts show up in stand-ups.
- Alert fatigue. Too many tiles flash yellow or red without context.
How to fix it
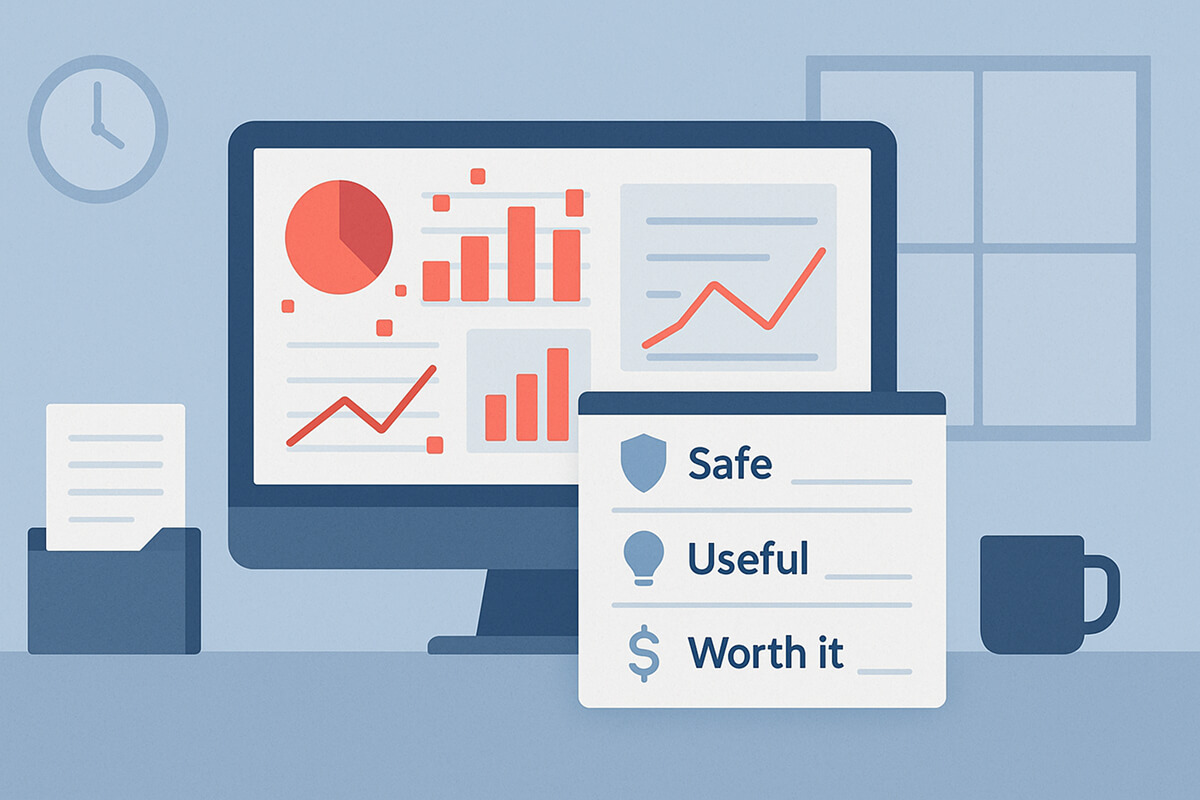
- Start with a “three-question scorecard.” Every Friday, answer only:
- Are we safe? (quality & risk)
- Are we useful? (customer impact)
- Are we worth it? (cost vs. value)
- Map charts to questions. Anything that doesn’t answer one of the three goes into an “icebox” tab.
- Review + prune monthly. Kill charts no one opened in the last 30 days.
- Add a narrative box. Five bullet lines: what went well, what regressed, top action items.
3. Noisy or Sparse Feedback Signals
Thumbs-up data is often thin or biased, resulting in quality metrics that fluctuate wildly or drift off course.
Why it happens
- Only a small % of users bother to rate answers.
- Some customers always click 👍, others never do.
- A single feedback channel ignores silent failures (such as reformulation or abandonment).
How to fix it
- Blend implicit signals. Track reformulations, retries, and session abandonment as negative feedback; first-click success as positive.
- Prompt selectively. Request an explicit rating on 5-10% of sessions, but only when the system is confident that the answer is relevant.
- Weight feedback sources. Combine explicit, implicit, and human labels using a simple weighting scheme to prevent a single noisy channel from dominating.
4. Drifting Models and Stale Prompts
Quality drops after content updates, new provider versions, or slow creep in prompts.
Why it happens
- Knowledge bases evolve; prompts don’t.
- Model providers silently upgrade versions.
- Retrieval rules or embeddings age and lose relevance.
How to fix it
- Content-drift monitors. Alert when new docs or KB edits exceed a set delta (e.g., 10% of the article corpus added in one day).
- Book a 30-minute prompt audit every month; treat prompts like code diffs, owners, and approval.
- Model-version pinning + canary. Pin to a version and test the new one on 5% traffic first.
- Automatic fallback path. Keep a last-known-good model and prompt; on two consecutive SLO breaches, the guardrail flips traffic back.
5. Costs Creeping Up
Average token usage continues to rise, extra tool calls increase, and Finance is caught off guard by sudden spikes in the cloud bill.
Why it happens
- Prompt chains get longer over time.
- Engineers add tools “just for this feature,” then forget them.
- Higher-quality models slip into less-critical paths.
How to fix it
- Track Cost per Successful Outcome (not just tokens). This tells you if spending still buys value.
- Budget-cap pricey flows. Example: “Support-GPT EN locale may spend $X per day.” Violations alert the owner.
- Monthly token audit. Dump top-N prompts by token cost, review additions, and trim fluff.
- Fan-out guardrail. Alert if a request spawns more than N tool calls or subtasks.
FAQs
1. How can a framework support governance and compliance?
By turning policies into measurable controls for log retention SLAs, PII redaction rates, jailbreak detection, bias tests by segment, and a documented review cadence. Attach model cards to every release and use gated rollouts with audit logs.
2. What are the biggest challenges when operationalizing measurement?
Shared definitions and reliable instrumentation. Solve these with a metric catalog, schema contracts, and CI tests that validate queries against fixtures.
3. How often should we update tools or KPIs?
Continuously for the system, quarterly for KPI re-evaluation. If a KPI never changes a decision, drop it. If a new user behavior emerges, add a targeted metric and test it in parallel first.
4. Can one framework serve multiple models or departments?
Yes, by standardizing event schemas and categorizing metrics by domain. Maintain a shared backbone (including latency, error, and safety), then allow each team to add their domain-specific KPIs.
5. How does human feedback improve accuracy?
It closes gaps that automated evals miss (context nuance, tone). Use double-blind human evals on sampled sessions, enrich with rater notes, and correlate with online success signals.
Conclusion
A solid measurement system is the difference between “we hope it’s working” and “we know where to invest.” Build it in layers for scope, domains, precise KPIs, instrumentation, governance, and communication. As your product and data mature, evolve the AI measurement framework and, where appropriate, define an AI performance measure that ties every improvement back to real outcomes.