Software development teams are often pressured to release new features quickly. However, they must also ensure that everything works well and meets quality standards. The real difference between teams that excel and those that struggle is how well they can measure, understand, and improve their delivery processes.
Lead time and cycle time are crucial in indicating to developers whether their development workflow is progressing smoothly or encountering bottlenecks.
However, many teams confuse lead time and cycle time, or they fail to utilize them in ways that enhance their day-to-day work. So, let’s discuss what these metrics really mean, how they differ, and how to use them effectively to improve your team’s performance.
What is Lead Time?
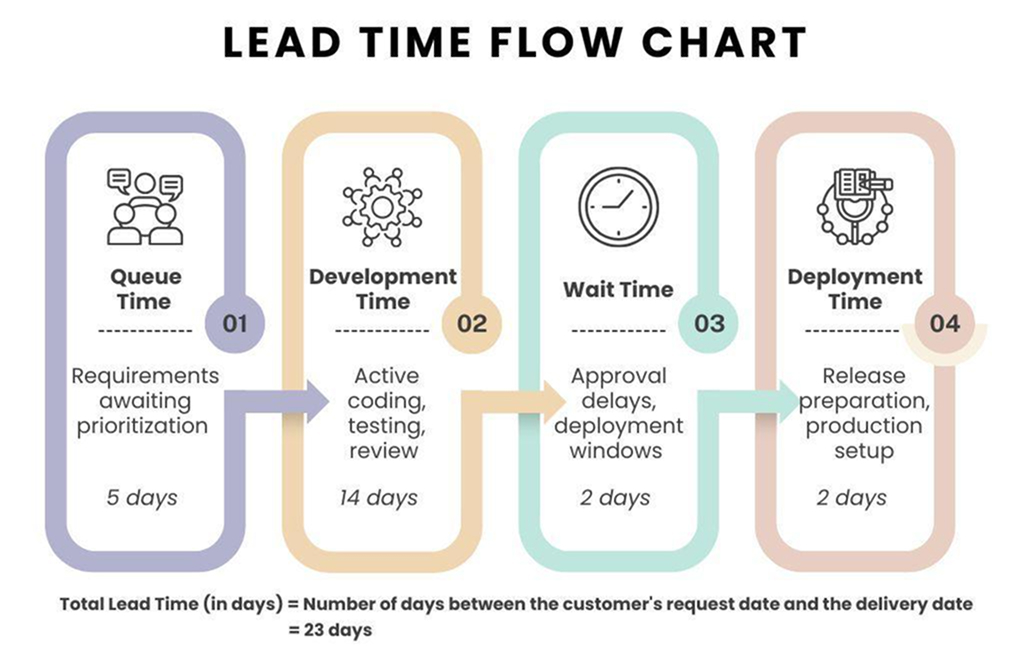
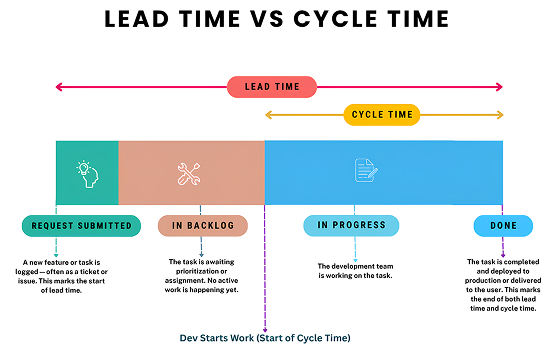
Lead time in software development refers to the total time elapsed from when a feature request is made until it is delivered to end users in production.
- Includes all stages: planning, analysis, design, development, testing, deployment, and release.
- Starts when a request is formally recorded or approved (e.g., entered in the backlog or tracking system).
- Ends when the feature is live and available to users.
- Covers both active work and wait times, including reviews, hand-offs, and approval delays.
- Useful for capacity planning, setting realistic delivery expectations, and aligning engineering timelines with business goals.
How to Calculate:
Lead Time = Delivery Date - Request Date
Example:
If a new login feature is requested on June 1 and released on June 24, the lead time is 23 days.
Why it matters:
Lead time offers a customer-centric perspective. It reflects how quickly your team can respond to market needs and deliver value.
What is Cycle Time?
Cycle time measures active work duration on specific tasks, focusing exclusively on periods when developers are directly engaged in development activities.
- Focuses only on the execution phase, excluding time spent in backlog, planning, or waiting.
- Starts when a developer begins working on a task (e.g., moves it from “To Do” to “In Progress”).
- Ends when the task reaches a defined completion state (e.g., “Done,” “Ready for Release,” or merged to main).
- Tracks the life of individual work items such as features, bug fixes, or user stories.
- Reveals how efficiently a team can turn started work into finished deliverables.
- Enables more accurate sprint planning and forecasting based on historical averages.
How to Calculate:
Cycle Time = Completed Date - Start Date
Example:
If development for a bug fix begins on June 5 and is completed on June 10, the cycle time is 5 days.
Why it matters:
Cycle time offers an internal performance view. It helps engineering teams optimize workflow, identify slowdowns, and improve development speed.
Key Differences: Lead Time vs. Cycle Time
Understanding the distinction between lead time and cycle time is essential for optimizing software delivery. Together, they provide a complete picture, from when a customer requests a feature to when it’s delivered.
Measurement Scope and Strategic Applications
Lead Time (End-to-End View)
- Measures the entire journey of a feature from request to release.
- Captures customer experience, including planning, prioritization, approvals, and delays outside the development team.
- Used for capacity planning, stakeholder communication, and aligning engineering with business goals.
- Lead time optimization requires cross-functional collaboration involving product management, QA, DevOps, and release coordination.
- Lead time helps set delivery expectations, customer commitments, and broader roadmap timelines.
Cycle Time (Execution Efficiency)
- Measures only the active development phase, starting when work begins and ending when it’s completed.
- Excludes waiting periods and external dependencies.
- Useful for tactical process improvement, such as identifying bottlenecks in coding, testing, or review.
- Cycle time enables more accurate sprint forecasting and fine-tuning of developer-level productivity.
- Cycle time optimization is primarily engineering-driven, focusing on workflow improvements such as faster code reviews, enhanced test automation, and reduced work-in-progress (WIP).
Example Breakdown
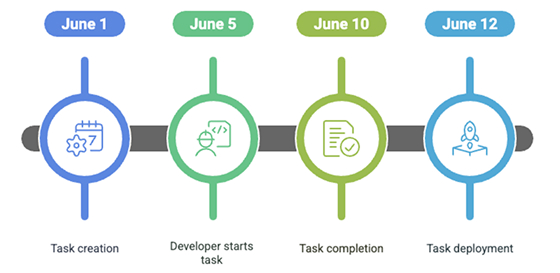
- Imagine a task is created on June 1:
- It sits in the backlog until June 5 (4 days)
- Developer starts on June 5 and finishes on June 10 (5 days)
- Deployed on June 12 (2 days later)
Lead Time: 12 - 1 = 11 days

Cycle Time: 10 - 5 = 5 days
Interplay Between Lead Time and Cycle Time
While lead time and cycle time offer distinct insights, their interdependence is crucial for end-to-end delivery success. Optimizing one without considering the other can limit results or even create new bottlenecks.
Why Balance Matters
- Lead time sets customer expectations.
- Cycle time reflects internal team performance.
- Focusing solely on cycle time may mask upstream delays (e.g., backlog delays and prioritization issues).
- Focusing solely on lead time may overlook inefficiencies in coding, testing, or deployment processes.
Example of Imbalance
- A team reduces cycle time by finishing development tasks faster.
- However, lead time remains high because tasks remain in the backlog for too long before being started.
- Result: Customers still wait too long, and the overall delivery speed has not improved.
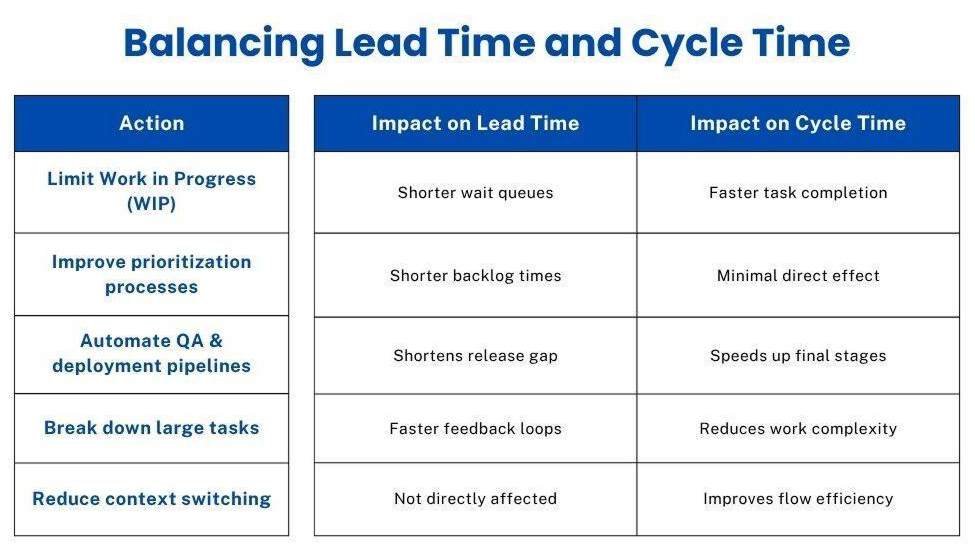
How to Balance Lead Time and Cycle Time

When to Prioritize Lead Time vs. Cycle Time
Focus on Lead Time when:
- Customer satisfaction and time-to-market are top priorities.
- You need visibility into the full delivery pipeline (from request to release).
- You want to shorten delays caused by backlog, prioritization, or deployment steps.
- Product managers are asking, “How long will this take from request to delivery?”
Focus on Cycle Time when:
- Your primary goals are to enhance developer productivity and improve internal workflow efficiency.
- You want to identify slowdowns in development, review, or QA.
- You aim to reduce interruptions, rework, or context switching.
- You want to increase throughput and reduce task switching or blockers.
- Developers often feel busy, but their output is slow, which may indicate a high cycle time.
Cycle Time vs. Processing Time
Cycle time and processing time are related but distinct metrics that offer different lenses on development performance.
Cycle time
- Total time from when a task starts to when it ends.
- It includes both active work and any idle time during that period (e.g., waiting for code review).
- Cycle time is useful for spotting system-wide bottlenecks.
Processing time
- Only counts the time spent actually working on the task. (writing code, running tests, making fixes).
- Processing time reveals how much effort a task truly requires.
Example:
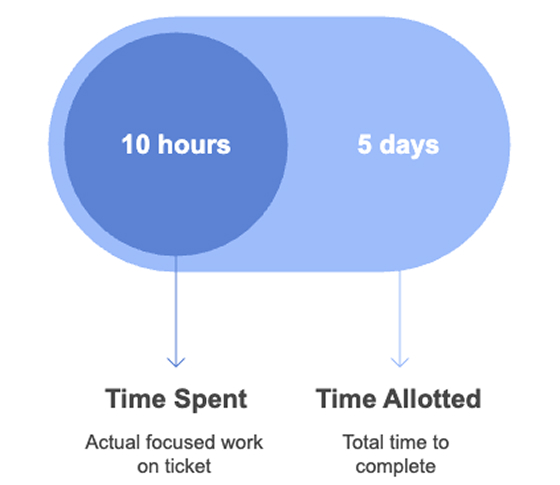
- A developer picks up a ticket on Monday and completes it by Friday.
- Cycle time: 5 days
- The developer was pulled into meetings and context-switched between tasks, only spending 10 focused hours on the ticket.
- Processing time: 10 hours
Key Insights:
- High lead time + low cycle time → backlog or deployment issues.
- High cycle time + low processing time → interruptions or inefficiencies.
Improving Lead Time & Cycle Time
Improving both lead time and cycle time requires a systematic approach that targets different parts of the delivery process. This involves identifying bottlenecks, refining workflows, and applying focused strategies across planning, development, and deployment stages.
Lead Time Improvement Strategies
- Process standardization: Establishes consistent workflows and approval procedures that minimize decision-making delays and eliminate ad-hoc coordination requirements.
- Automation focus: Accelerates routine activities like testing, deployment, and environment setup while reducing manual errors and rework cycles.
- Strategic dependency management: Restructures feature requirements to minimize cross-team coordination and leverage existing system capabilities.
- Systematic bottleneck analysis: Identifies process constraints limiting delivery capacity and focuses improvement efforts on the most restrictive elements.
Cycle Time Improvement Strategies
- Environment optimization: Ensures efficient tooling, fast build systems, and reliable infrastructure that directly reduces iteration cycle duration.
- Review process improvement: Balances quality assurance with development velocity through optimized assignment protocols and automated quality checks.
- Proactive technical debt management: Prevents complexity accumulation that slows future development time through regular refactoring and architecture improvements.
- Continuous skill development: Improves individual performance through cross-training, mentoring programs, and knowledge-sharing initiatives.
Measurement and Monitoring Best Practices
To deliver software faster and more reliably, teams must have well-structured measurement and monitoring best practices, reducing lead time and cycle time.
- Baseline establishment: Consistent measurement and trend analysis with established improvement targets and regular progress reviews.
- Variability focus: Reducing inconsistency (e.g., wild fluctuations in cycle time) can be as impactful as improving the average.
- Data-driven decisions: Rely on measured outcomes rather than assumptions or intuition when refining processes.
- Limit Work in Progress (WIP): Having fewer concurrent tasks means better focus and faster completion.
- Use visual boards: Tools like Jira make bottlenecks visible.
- Prioritize clearly: Reduce backlog wait time by prioritizing based on impact.
Tools for Tracking:
- LinearB: Offers real-time lead and cycle time insights.
- Jira: Can be configured to track custom time metrics.
- Waydev: Connects with Git providers to measure cycle and lead times precisely.
Final Thoughts
Understanding the differences between lead time and cycle time is essential for optimizing software delivery performance. These complementary metrics enable data-driven decisions across organizational levels. For example, product managers use lead time for customer communication, while engineering managers leverage cycle time for capacity planning.
Successful teams view lead time and cycle time as interconnected rather than isolated metrics. By measuring and optimizing them systematically, organizations shift from reactive firefighting to predictable, high-performance delivery. This transformation not only enhances speed and reliability but also establishes a lasting competitive advantage in fast-paced markets.