How to Measure Code Productivity in the Age of AI
8 min read• Apr 01, 2026
Written by

Milestone Team

Software teams have long tried to answer one question: how do we know if engineering work is productive? For years, the answer seemed simple. Count lines of code, commits, pull requests, or hours worked. These signals were easy to track and easy to compare.
That approach is much less useful now. AI coding assistants, code completion tools, automated documentation, and test generation tools have changed how software gets built. Developers can move faster, try more options, and automate work that once took hours. The problem is that many teams still rely on old metrics. If AI helps generate code quickly, output volume alone becomes an unreliable signal. A team may look more productive on paper while quality, customer value, and maintainability stay the same.
The better question now is not how much code was produced. It is whether the team delivered useful software efficiently, safely, and sustainably.
The common metrics were already flawed before AI tools became part of everyday development. AI makes those flaws easier to see.
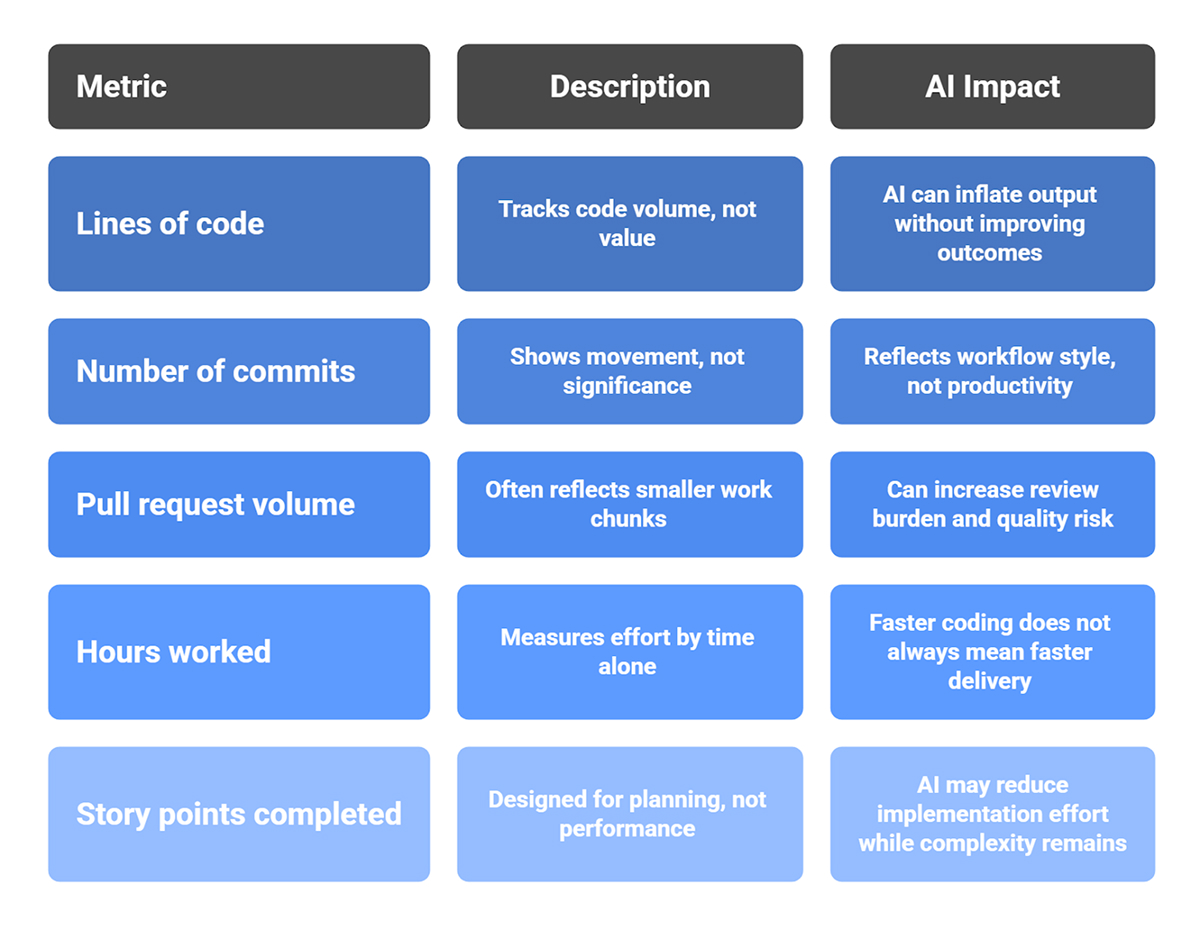
Lines of code have always been a weak measure of engineering value. More code does not mean better code. In many cases, a better solution is the one that removes complexity, reduces duplication, or solves the problem with fewer moving parts.
Now add AI into the mix. With AI assistance, a developer can generate scaffolding, helper functions, tests, and repetitive structures in a few minutes. That makes output look larger, but it does not tell you whether the change is useful, secure, or maintainable. The source document explicitly recommends moving away from this measurement style and focusing instead on value delivered, time to impact, and reliability.
Commit count can show movement, but it does not show significance. AI-assisted workflows may encourage smaller commits, faster experimentation, and more rapid iteration. That can be helpful, but it also means commit volume may rise without any direct increase in business value. The number reflects workflow style, not productivity.
The same issue appears with PRs. More pull requests may mean the team is breaking work into smaller chunks or using AI to accelerate drafting. It does not automatically mean the team is solving more valuable problems. In fact, a higher PR volume can create another issue: reviewers now spend more time reviewing generated code, validating logic, and ensuring quality has not slipped.
Hours are a poor productivity metric in any knowledge-based job, and software engineering is no exception. If AI shortens implementation time, that should be treated as progress. It should not make leaders suspicious because a task took fewer hours than before. Measuring effort by time alone often rewards friction, not effectiveness.
Story points were designed for planning. They were never meant to be used as individual or team performance scores. When teams try to use them that way, the signal becomes distorted. AI makes this even messier because it may reduce implementation effort while leaving review, testing, and deployment complexity unchanged. The source brief includes story points among the traditional signals, but these become unreliable once AI tools are part of delivery.
This is the key shift. AI can increase what appears to be activity without increasing what matters.
According to the brief, AI can accelerate drafting and scaffolding, generate documentation and tests, suggest refactoring, and accelerate experimentation. At the same time, it can also increase code volume without increasing value, introduce subtle bugs or security risks, and shift effort from writing code to reviewing and validating it. That means visible output becomes easier to inflate.
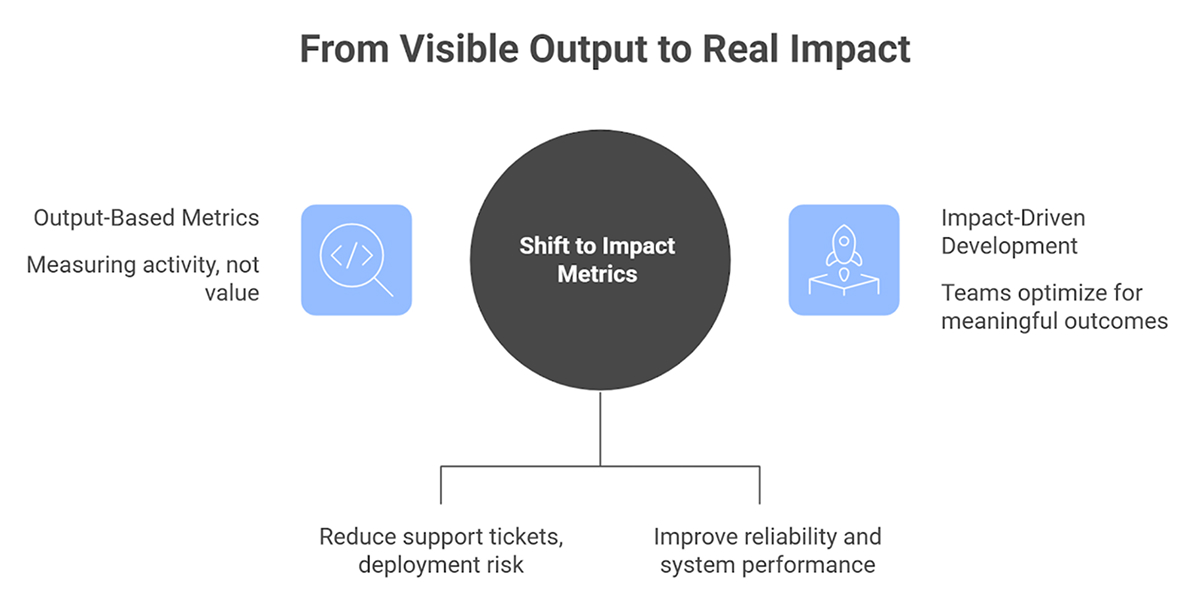
If leaders continue to reward output-based metrics, teams may begin to optimize for motion rather than impact. That is a dangerous trap because it creates the appearance of progress while hiding weak outcomes.
A developer who ships fewer lines of code but improves system reliability, reduces support tickets, and cuts deployment risk may be creating far more value than someone who produces a large AI-generated patch. Old metrics struggle to capture that difference.
A better model starts with a simple idea: productivity should reflect value creation, not raw activity. The source brief outlines a stronger set of measurements for modern engineering teams, especially when AI is part of the workflow.
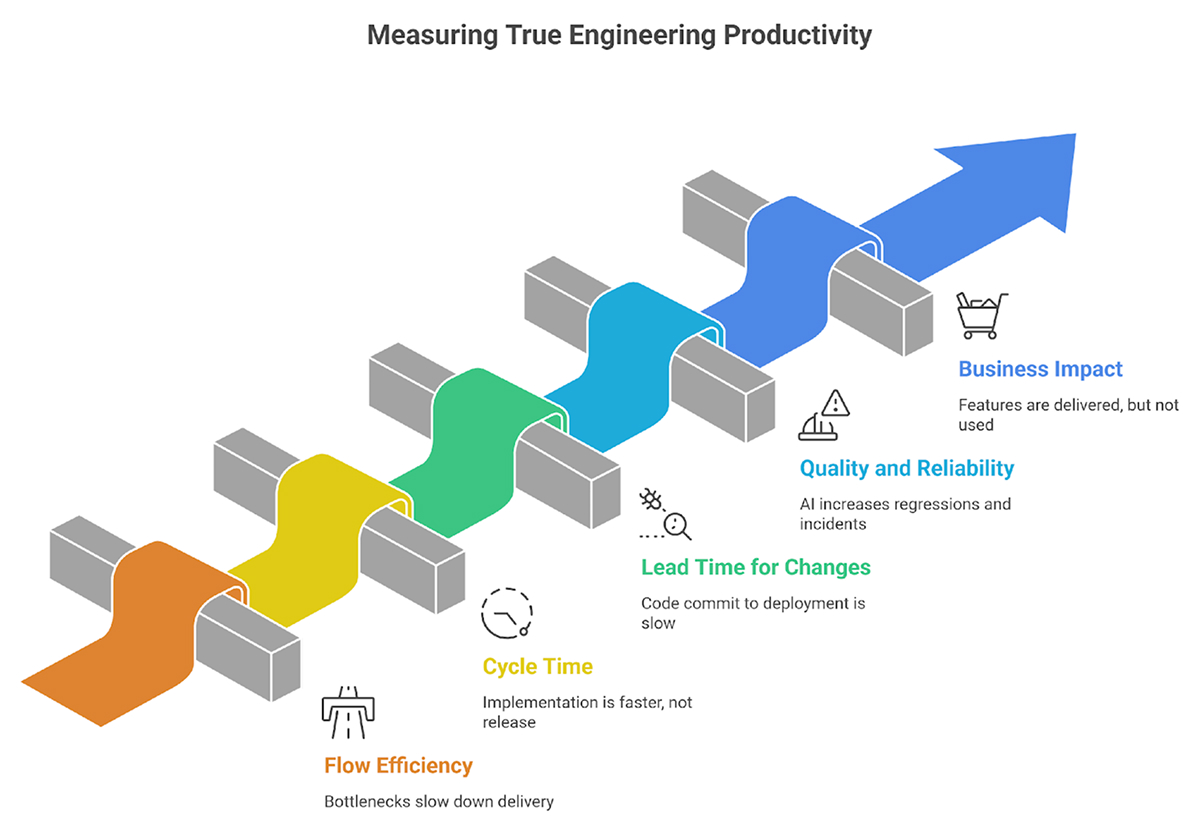
Flow efficiency measures active work time relative to waiting time. It also highlights bottlenecks in review, testing, deployment, and handoffs.
This is important because AI often speeds up one stage of work, usually the drafting or implementation stage, without fixing the rest of the delivery system. A team may produce code faster and still wait days for review, QA, security checks, or deployment approval.
When teams track flow efficiency, they start asking better questions:
These questions lead to operational improvements that matter.
Cycle time measures the time from work start to production release. The brief specifically notes that AI may shorten implementation time but not reduce review or deployment time.
That distinction matters. If coding becomes faster but the full path to production stays the same, then engineering productivity has not improved as much as people assume. The speed gain exists, but it is confined to a single stage of the system.
Cycle time helps teams see the whole journey, not just the first draft.
Lead time for changes tracks the time from code commit to successful deployment. The brief links this measure with deployment frequency and change failure rate.
This is one of the best ways to understand delivery effectiveness because it connects engineering activity to working software in production. It answers practical questions:
In a world full of AI-assisted development, that is a much more honest metric than simple output counts.
The brief also emphasizes defect rates, incident frequency, rework percentage, and test coverage and stability.
This is where teams protect themselves from false productivity gains. If AI helps generate more code but also increases regressions, flaky tests, or post-release incidents, then the team is not truly more productive. The cost has simply moved downstream.
Useful quality measures include:
These metrics reveal whether speed is driving sustainable progress or costly cleanup.
This is often the most important measure and the least discussed. The source brief points to customer adoption, revenue influence, retention improvements, and performance improvements as stronger indicators of value.
That makes sense. Software exists to create outcomes. A release matters because it improves the business or the user experience. If a feature was delivered quickly but nobody uses it, the productivity story is incomplete. If a small backend improvement reduces latency, cuts cloud cost, and improves customer satisfaction, that work may be far more valuable than a visible feature launch.
This is where code productivity metrics become meaningful. They connect technical work to real results.
One of the most useful points in the source brief is that AI shifts effort, not just how fast code is written.
That idea deserves attention. AI does reduce effort in some areas:
But it often increases effort in other places:
This is why AI for developer productivity should be discussed carefully. AI can absolutely help teams move faster, but the benefit is not as simple as “developers type less.” It is more accurate to say that AI redistributes effort across the software lifecycle.
That shift makes shallow measurement even less useful.
The source brief provides practical guidance: combine quantitative metrics with qualitative feedback, review business impact alongside speed, monitor defect trends, track review and validation effort separately, and align productivity metrics with strategic objectives.
That advice is strong because it reflects how engineering really works. Metrics should inform decisions, not replace judgment.
A sensible approach looks like this:
The last point matters more than many dashboards suggest. Sustainable productivity includes speed, quality, and long-term maintainability, along with team health and burnout indicators. The source brief explicitly calls that out.
If teams want a more useful dashboard, they should focus on a small set of balanced metrics rather than a large pile of activity counts.
A practical mix could include:
This kind of measurement better reflects what strong teams are trying to achieve. It also provides a more realistic view of whether AI tools for developer productivity are actually helping or simply making output appear larger.
Measuring engineering productivity in the AI era requires more discipline, not less. The easy signals are still available, but they are no longer trustworthy on their own. AI can increase code volume, commit activity, and visible movement very quickly. That does not mean it increases value.
The better approach is to measure delivery speed, quality, reliability, business impact, and sustainability together. Teams should pay attention to how work flows through the system, how often changes succeed in production, how much value each release creates, and whether the pace is maintainable over time. That is a stronger and more honest way to understand productivity in modern software development, and it aligns with the clear direction laid out in your source brief for 2026-style measurement.
Metrics such as lines of code, commit counts, pull request volume, hours worked, and story points become much less reliable once AI starts generating or accelerating visible output. They may still provide context, but they should not be treated as primary signals of value.
Yes. The source brief explicitly notes that AI may increase code volume without increasing value. Teams can ship more visible output while quality, adoption, retention, or revenue impact remain unchanged. That is why business outcome measures are essential.
They should combine quantitative metrics with qualitative feedback, review business impact alongside delivery speed, monitor defect trends, track validation effort separately from code generation, and align measurements with strategic goals rather than raw activity.
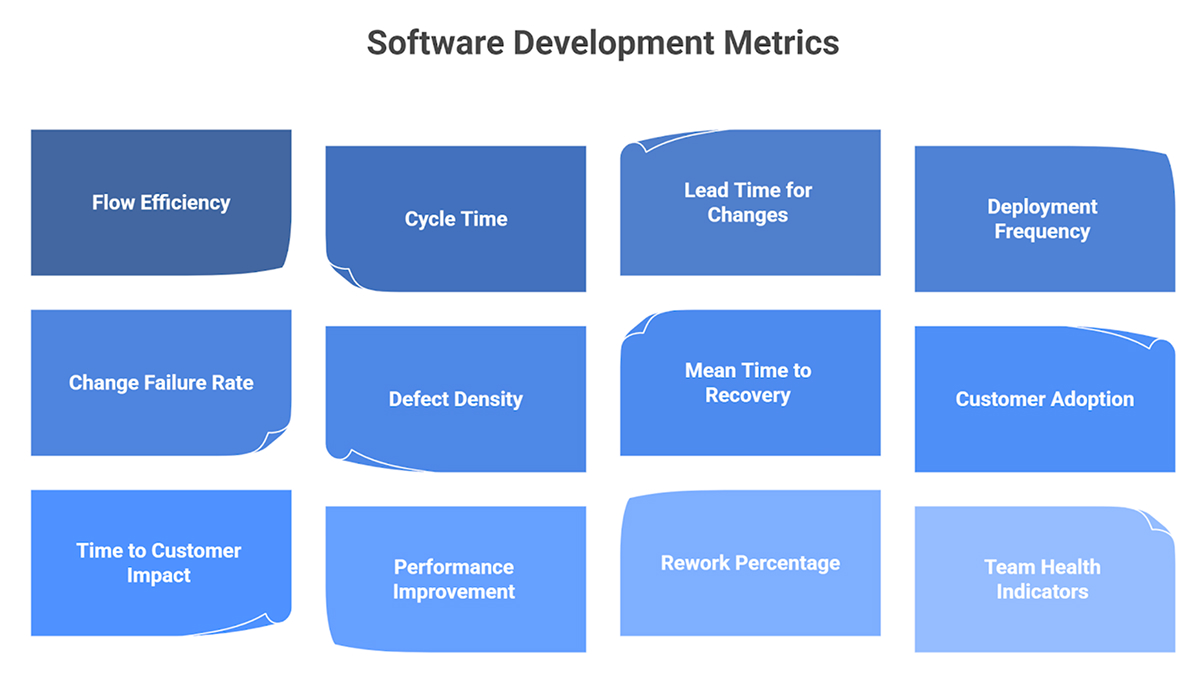
The brief recommends focusing on value delivered per release, time to customer impact, customer satisfaction or adoption, defect density, reliability, change failure rate, mean time to recovery, and team health indicators.
Sign up to our newsletter
By subscribing, you accept our Privacy Policy.