Top Software Quality Metrics You Need to Track
4 min read• Oct 17, 2025
Written by

Milestone Team

Maintaining software quality is an important step in the software development lifecycle. Low software quality can lead to high maintenance costs, unhappy users, and even system failures, ultimately eroding trust.
This is where quality metrics in software engineering become essential as they provide a structured way to assess different aspects of software, from performance to maintainability. By tracing the right metrics, teams can make data-driven improvements that enhance both the development process and the final product.
In this article, we’ll explore essential software quality metrics, their importance, and how to track them effectively. Whether you’re wondering how to measure software quality or looking for practical ways to implement software implementation metrics, understanding and applying the right metrics will provide you with a solid foundation to enhance your software quality strategy.
Software quality metrics are a specific type of software metrics that emphasize the quality of the product, process, and project. They are more directly linked to process and product metrics than to project metrics. These include performance, security, and maintainability.
There are different categories of metrics, such as:
Keeping an eye on these metrics is essential for maintaining high software quality and ensuring that you meet both user expectations and regulatory standards.
Monitoring software quality metrics offers several key advantages.
Here are some of the most important metrics in software engineering that every development team should prioritize:
Well-written code reduces the likelihood of introducing bugs into the code base. It also makes it easier for new team members to grasp and contribute to the codebase. In addition, it minimizes technical debt.
Cyclomatic complexity M would be defined as,

Image Reference: https://www.geeksforgeeks.org/cyclomatic-complexity/
Reliability metrics evaluate the software’s ability to function consistently over time. Reliable software is less likely to fail, which is essential for user trust and system dependability. The following are some of the methods used to ensure the reliability of software programs.
Here is a conceptual diagram that visually represents MTBF.

Image Reference: created by the author
Performance metrics assess how well the software performs under specific conditions. These metrics are crucial for applications where speed and responsiveness have a significant impact on user satisfaction, particularly in consumer-facing applications.
Here is a conceptual diagram that visually represents how response time impacts user experience.
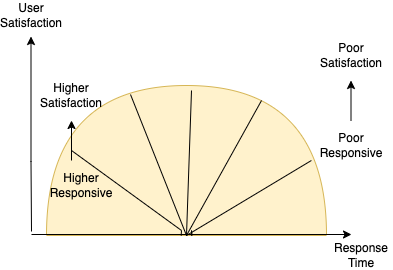
Image Reference: created by the author
Security metrics are critical for protecting user data and preventing security breaches. As security issues can severely impact both users and the organization, tracking these metrics is essential, especially for applications handling sensitive information.
Well-maintained code helps control future costs and makes it easier to adapt the software to new needs. These metrics measure how easy it is for developers to update, fix, or improve the software.
The following diagram depicts technical debt red flags.
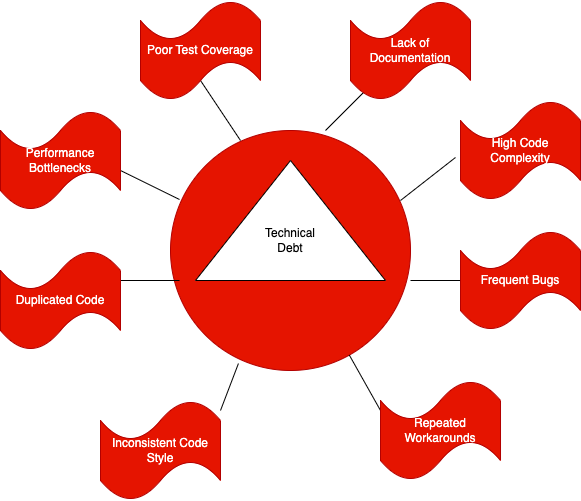
Image Reference: created by the author
The following shows common Big O notations from an algorithmic analysis.
Software usability metrics are a way to measure how effective, efficient, and satisfying a product is to use. They can help designers quantify usability objectively rather than making assumptions. For consumer apps, a great user experience can determine the difference between users adopting or abandoning the product.

Image Reference: created by the author
Test coverage metrics are qualitative indicators that ensure every aspect of the software is thoroughly tested for quality and reliability. They track how much of the application has been covered by the testing suite during development. These Agile metrics help development teams create a high-performing product that meets user expectations. Higher test coverage often correlates with fewer bugs reaching production.
Customer satisfaction metrics indicate how users perceive the software’s quality. This metric helps measure how happy and satisfied customers are with a product or service. Some examples of these metrics include:
In NPS, customers are categorized into three groups based on their response to the question, “How likely are you to recommend our product or service to a friend?”
Respondents rate their answers on a scale from 0 to 10, and their score determines their category.
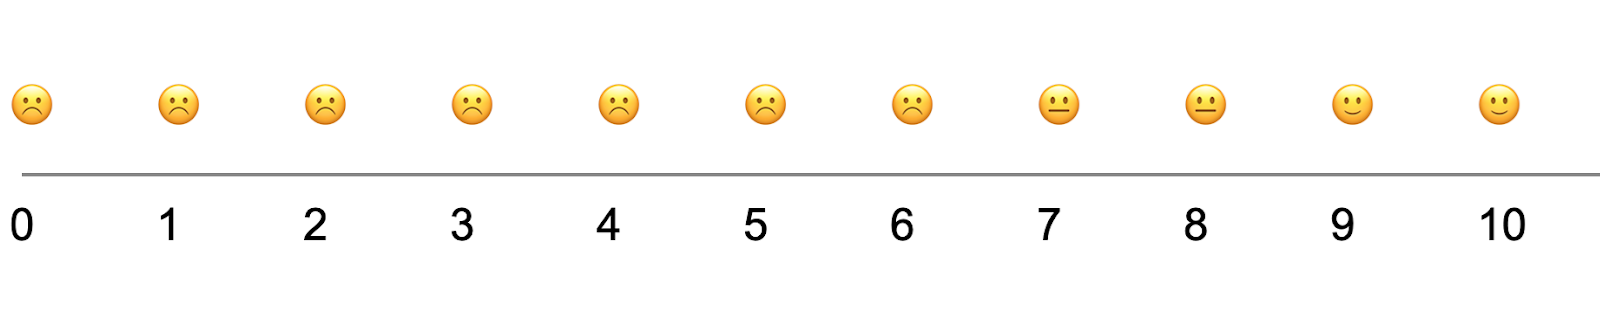
Image Reference: created by the author
In industries with strict regulations, compliance metrics are essential to ensure that software meets the necessary standards and follows legal requirements. These metrics help verify that the software meets all necessary regulatory requirements, reducing the risk of legal issues and ensuring its proper operation within regulated environments.
The image below illustrates some of the key compliances that certain industries must adhere to.
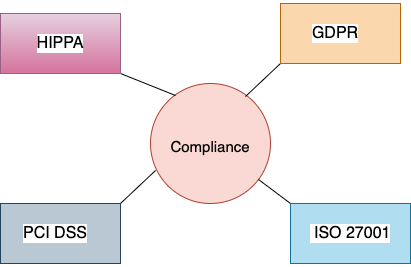
Image Reference: created by the author
GDPR: General Data Protection Regulation
HIPAA: Health Insurance Portability and Accountability Act
PCI DSS: Payment Card Industry Data Security Standard
ISO 27001: International standard for information security management
Effectively tracking quality metrics software teams depend on requires a strategic approach.
Below is an image of the Grafana dashboard, which is one of the monitoring tools available.
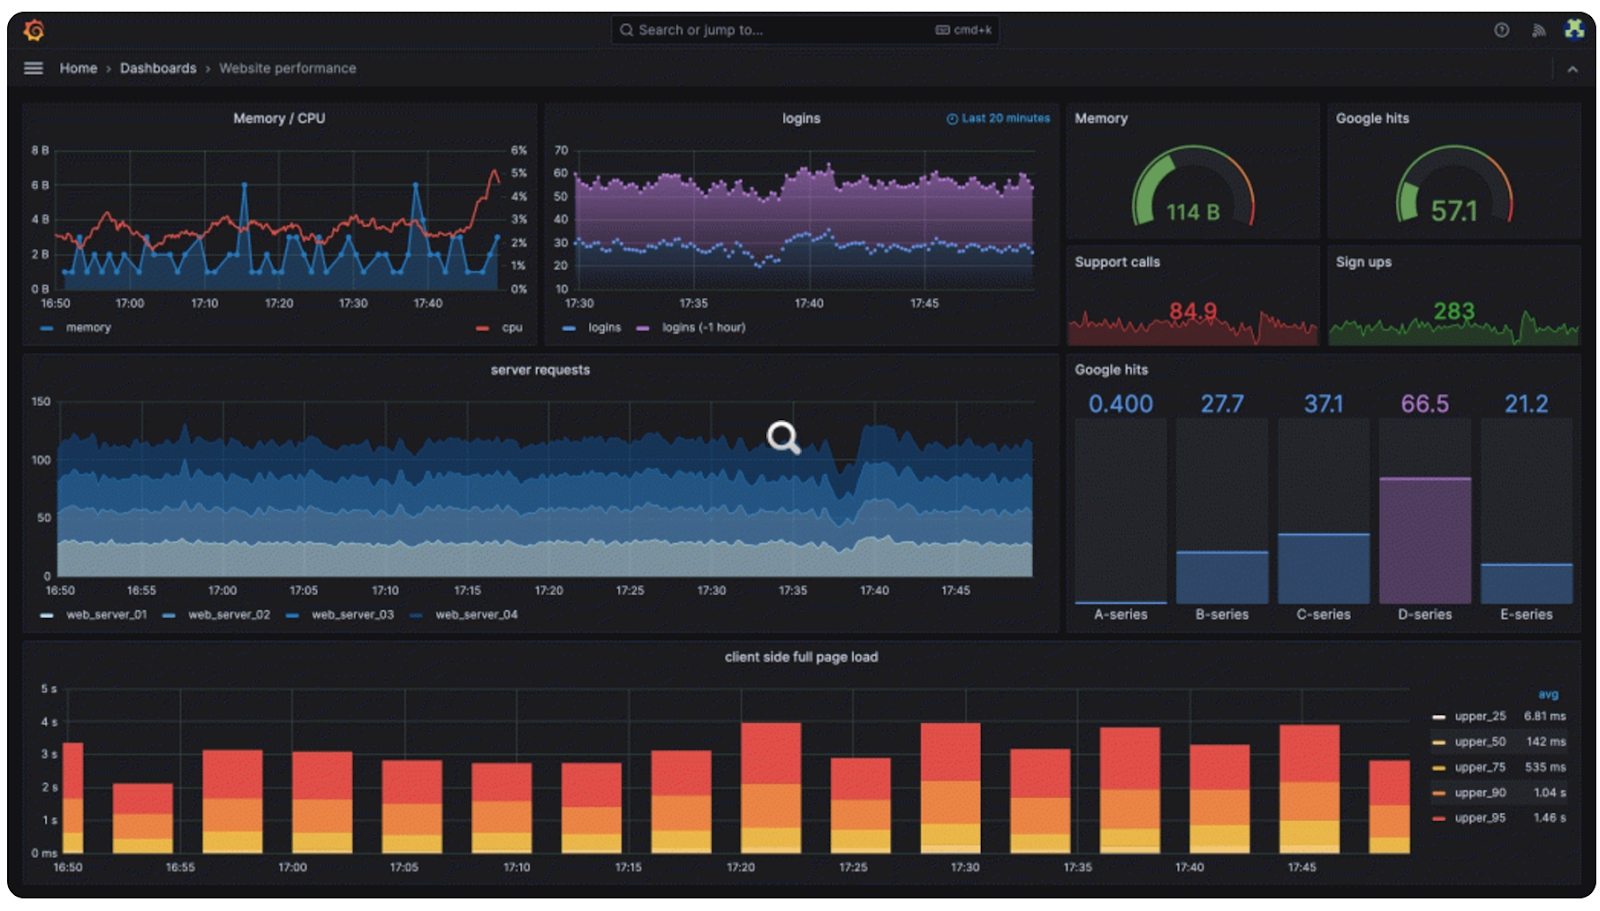
Image Reference: https://grafana.com/oss/grafana
Not all metrics work for every project. When selecting quality metrics in software engineering, it’s important to choose measures that align with the type of software and the specific goals of your project.
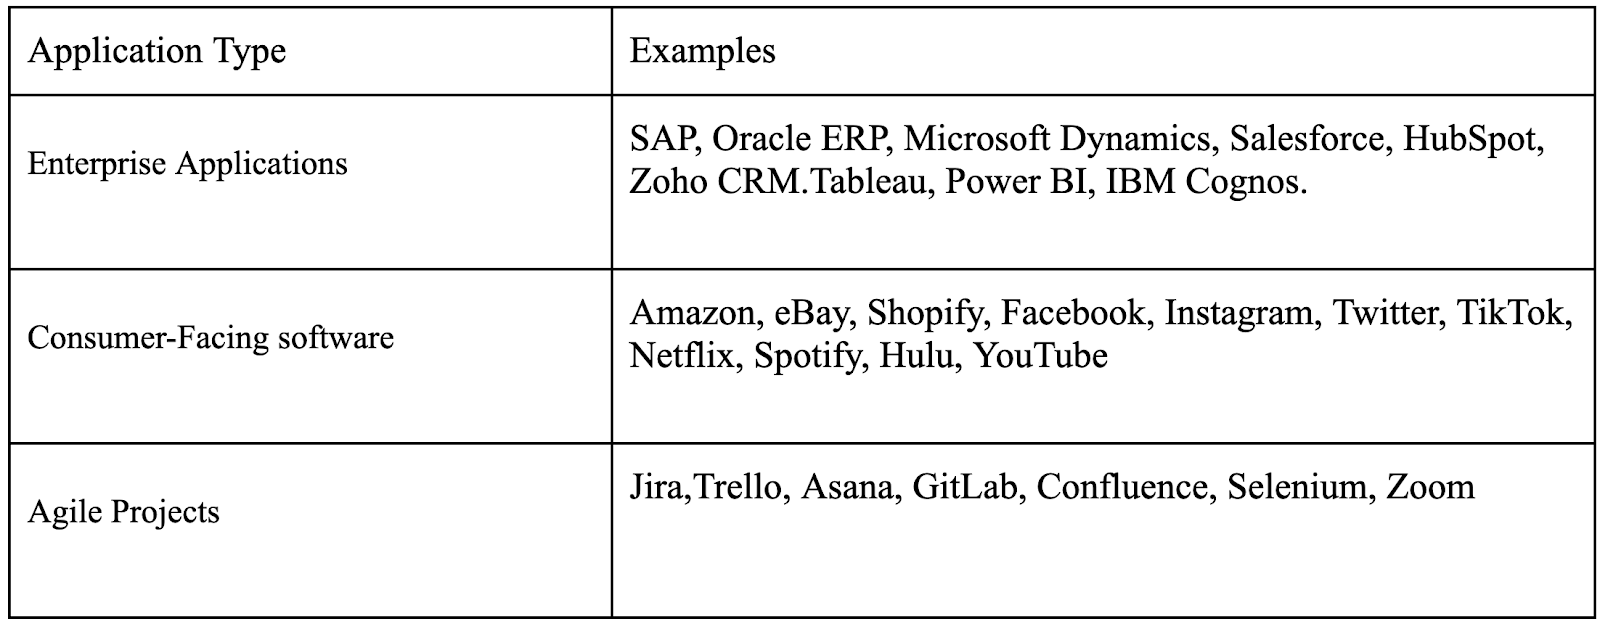
Consider your software’s purpose, industry, and audience when selecting metrics to ensure they provide relevant insights.
Below is a quick tour of popular platforms that help automate measurement and keep quality front-of-mind. Each solves a different slice of the problem; many teams combine several.
Tracking the right metrics for software quality is essential for creating reliable, efficient, and user-friendly software. By focusing on areas like code quality, user satisfaction, performance, and security, teams gain clear insights to guide improvements and deliver high-quality products.
Making sure these metrics match your project’s goals helps keep your efforts focused and efficient, improving the overall quality strategy. For instance, consumer apps with large user bases may prioritize usability and performance, while enterprise software may focus more on compliance and maintainability.
Incorporating these metrics into the software development lifecycle enables continuous improvement. Regular evaluation provides data that inform iterative updates and proactive solutions, helping your team address issues early and adapt to evolving user needs. This approach not only meets user expectations but can exceed them, creating software that stands out for its quality and dependability.
Sign up to our newsletter
By subscribing, you accept our Privacy Policy.