System reliability and engineering velocity are no longer optional in today’s competitive software market; they’re must-haves for businesses. When you’re in charge of complex distributed systems with frequent deployments, you can’t rely solely on your instincts and feelings. Your clients and stakeholders need reliable metrics to assess your success.
DevOps metrics provide a quantitative foundation for engineering decisions, transforming reactive incident management into proactive system optimization. They enable you to:
- Identify bottlenecks before they impact user experience.
- Validate architectural decisions with concrete performance data.
- Demonstrate engineering impact to stakeholders in business terms.
- Guide capacity planning and infrastructure investments.
- Optimize team processes based on empirical evidence.
Without comprehensive metrics, even the most experienced engineering teams operate with limited visibility into the true performance and reliability characteristics of their delivery pipeline.
What Are DevOps Metrics and KPIs?
DevOps metrics are quantitative measurements that capture the performance, efficiency, and health of your software delivery lifecycle. For engineers, these metrics serve as debugging tools for your entire development and operations process.
Key distinctions:
- Metrics = Raw measurements (e.g., deployment frequency, error rates).
- KPIs (key performance indicators) = Business-aligned indicators derived from metrics.
- SLIs = Service level indicators that define system health.
- SLOs = Service level objectives that set performance targets.
These measurements create feedback loops essential for continuous improvement:
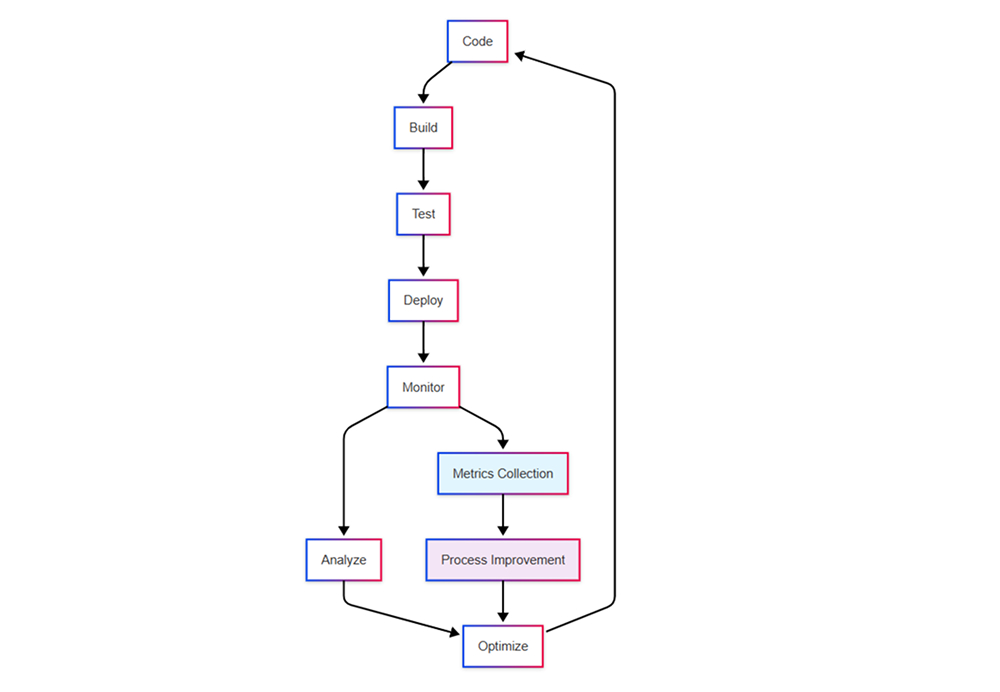
They enable teams to experiment with new processes, measure the impact of changes, and iterate toward better outcomes. Most importantly, they provide objective evidence of progress, helping teams celebrate wins and learn from setbacks.
Key Categories of DevOps Metrics
DevOps metrics can be organized into four fundamental categories, each addressing different aspects of software delivery excellence.
Performance Metrics
Focus on delivery speed and development efficiency:
- Deployment frequency and velocity
- Lead time and cycle time analysis
- Build and test execution times
- Code review turnaround metrics
Reliability Metrics
Measure system stability and fault tolerance:
- Uptime, availability, and service level agreement (SLA) compliance
- Error rates and failure patterns
- Recovery time and incident response
- Service degradation indicators
Scalability Metrics
Evaluate system capacity and growth handling:
- Throughput under varying loads
- Resource utilization patterns
- Performance degradation thresholds
- Auto-scaling effectiveness
Operational Efficiency Metrics
Assess resource optimization and team productivity:
- Infrastructure cost per transaction
- Resource utilization efficiency
- Team velocity and throughput
- Technical debt accumulation
The Top 20 DevOps Metrics and KPIs
Definition: Number of successful production deployments per time period
Engineering Relevance:
- High frequency indicates mature CI/CD automation
- Reduces blast radius of individual changes
- Enables faster feature iteration and bug fixes
- Correlates strongly with team maturity
Target Benchmarks:
- Elite performers: Multiple deployments per day
- High performers: Weekly to daily deployments
- Medium performers: Monthly deployments
- Low performers: Less than monthly
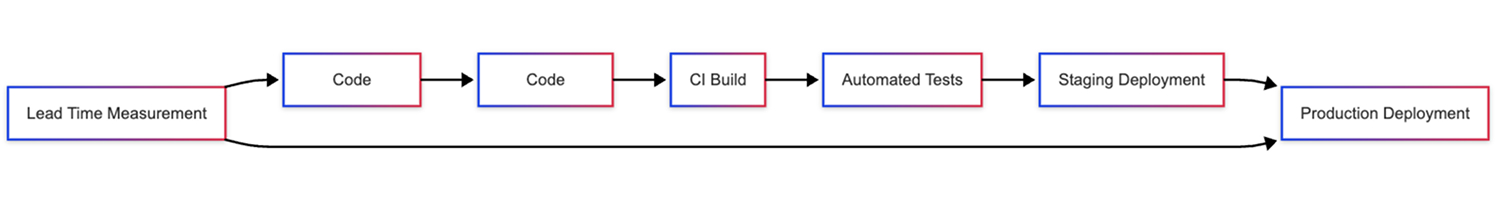
Definition: Time from code commit to production deployment
Technical Components:
- Code review and approval time
- Build and test execution duration
- Deployment pipeline processing time
- Manual approval and gating delays
Optimization Strategies:
- Parallelize build and test stages
- Implement automated quality gates
- Reduce manual approval dependencies
- Optimize artifact build and storage
Definition:Percentage of deployments causing production degradation
Calculation:
Failed Deployments / Total Deployments) × 100
Root Cause Categories:
- Insufficient test coverage
- Environmental configuration drift
- Database migration issues
- Third-party service dependencies
Engineering Actions:
- Implement comprehensive integration testing
- Use infrastructure as code for consistency
- Establish staging environment parity
- Develop rollback automation
Definition:Average time to restore service after incidents
MTTR Components:
- Detection Time: Time to identify the issue
- Response Time: Time to begin remediation
- Resolution Time: Time to implement a fix
- Recovery Time: Time to fully restore the service
Improvement Tactics:
- Implement comprehensive monitoring and alerting
- Develop automated rollback mechanisms
- Create incident response playbooks
- Practice chaos engineering scenarios
5. System Uptime/Availability
Definition: Percentage of time systems are operational and accessible
Availability Calculation:
Availability = (Total Time - Downtime) / Total Time × 100
Common SLA Benchmarks:
- 99.9% (8.77 hours downtime/year): Standard web applications and basic cloud services
- 99.95% (4.38 hours downtime/year): Critical business systems (e.g., Google Cloud Platform guarantees 99.95% monthly uptime)
- 99.99% (52.6 minutes downtime/year): High-availability systems and enterprise applications
- 99.995% (26.3 minutes downtime/year): Mission-critical systems requiring maximum uptime
Note: These are commonly used SLA targets based on industry practices and major cloud provider offerings. Actual requirements vary by business context and service criticality.
6. Error Rate
Definition: Percentage of requests resulting in errors
Monitoring Levels:
- Application Level: HTTP 4xx/5xx responses
- Service Level: Individual microservice failures
- Infrastructure Level: System and network errors
- User Experience Level: Client-side JavaScript errors
Example error rate calculation:
const errorRate = (totalErrors / totalRequests) * 100;
const isHealthy = errorRate < ERROR_THRESHOLD;
7. Response Time/Latency
Definition: Time between request initiation and response completion
Measurement Dimensions:
- P50 (Median): Typical user experience
- P95: Experience for slower requests
- P99: Worst-case user experience
- P99.9: Extreme outlier performance
Response time has a direct impact on user satisfaction and can affect conversion rates in customer-facing applications.
8. Throughput
Definition: Volume of work processed per unit of time
Measurement Types:
- Requests per second (RPS): Web application capacity
- Transactions per second (TPS): Database performance
- Messages per second: Queue processing rates
- Bytes per second: Data processing throughput
9. Code Coverage
Definition: Percentage of codebase exercised by automated tests
Coverage Types:
- Line Coverage: Percentage of code lines executed
- Branch Coverage: Percentage of decision branches tested
- Function Coverage: Percentage of functions called
- Statement Coverage: Percentage of statements executed
Best Practices:
- Target 80%+ coverage for critical business logic
- Focus on meaningful tests, not coverage gaming
- Implement coverage gates in CI/CD pipelines
- Track coverage trends over time
10. Test Success Rate
Definition: Percentage of automated tests passing consistently
Analysis Dimensions:
- Unit test stability and reliability
- Integration test environment dependencies
- Flaky test identification and remediation
- Test execution time and efficiency
11. Build Success Rate
Definition: Percentage of code integrations that compile successfully
Common Failure Causes:
- Merge conflicts and integration issues
- Dependency version incompatibilities
- Configuration and environment problems
- Code quality and syntax errors
12. Security Vulnerabilities
Definition: Count and severity of identified security issues
Vulnerability Classification:
- Critical: Immediate exploitation risk
- High: Significant security impact
- Medium: Moderate risk with exploitation barriers
- Low: Minor security concerns
Tracking Metrics:
- Time to vulnerability detection
- Time to patch deployment
- Vulnerability backlog aging
- Security scan coverage percentage
13. Infrastructure Cost per Transaction
Definition: Resource cost allocated per business transaction
Cost Components:
- Compute instance costs (CPU, memory)
- Storage costs (databases, file systems)
- Network transfer costs
- Third-party service expenses
Optimization Opportunities:
- Right-size instance types
- Implement auto-scaling policies
- Optimize database queries and indexing
- Cache frequently accessed data
14. Resource Utilization
Definition: Percentage of allocated resources actively used
Key Metrics:
- CPU Utilization: Target 70–80%
- Memory Utilization: Target 80–85%
- Disk I/O: Monitor queue depth and latency
- Network Bandwidth: Track saturation points
15. Team Velocity
Definition:Amount of work completed per development cycle
Velocity Components:
- Story points completed per sprint
- Feature delivery frequency
- Bug fix turnaround time
- Technical debt reduction rate
Contextual Factors:
- Team composition and experience
- Technical complexity and unknowns
- External dependencies and blockers
- Quality requirements and standards
16. Customer Satisfaction Score
Definition:Quantitative measure of user experience quality
Measurement Methods:
- Net Promoter Score (NPS) surveys
- Application store ratings and reviews
- Support ticket sentiment analysis
- User session behavior analytics
17. Time to First Byte (TTFB)
Definition:Duration from request to first response byte
TTFB Optimization:
- CDN configuration and edge caching
- Database query optimization
- Application server tuning
- Network routing optimization
18. Database Performance Metrics
atabase metrics help teams optimize queries and plan for scaling data storage.
Key Indicators:
- Query Response Time: P95 and P99 latencies
- Connection Pool Utilization: Active vs. available connections
- Lock Wait Time: Database contention indicators
- Slow Query Count: Performance degradation signals
19. API Performance and Reliability
For organizations with service-oriented architectures, API performance and reliability are highly crucial metrics.
Monitoring Focus:
- Endpoint-specific response times
- Rate limiting and throttling effectiveness
- Authentication and authorization latency
- Payload size and transfer efficiency
20. Incident Response Time
Definition: Speed of incident acknowledgment and response initiation
Response Time Breakdown:
- Alert generation and delivery
- On-call engineer acknowledgment
- Initial triage and assessment
- Escalation and team coordination
A quick incident response time is crucial for protecting assets, ensuring organizational compliance, and maintaining a positive reputation.
How to Use These Metrics Effectively
Implementation Strategy
To effectively implement DevOps metrics within an organization, it is best to follow a phase-based, incremental implementation approach.
Phase 1: Foundation
- Establish baseline measurements for core metrics
- Implement basic monitoring and alerting infrastructure
- Create initial dashboards for visibility
- Define SLOs for critical user journeys
Phase 2: Optimization
- Identify bottlenecks and improvement opportunities
- Implement automated remediation where possible
- Establish regular metric review processes
- Correlate metrics with business outcomes
Phase 3: Advanced Analytics
- Develop predictive alerting and anomaly detection
- Implement distributed tracing for complex issues
- Create custom metrics for specific architectural patterns
- Establish cross-team metric standardization
Tooling Ecosystem
Monitoring and Observability:
- Prometheus + Grafana: Open-source metrics and visualization
- Datadog: Comprehensive APM and infrastructure monitoring
- New Relic: Application performance monitoring
- Honeycomb: Observability with distributed tracing
Custom Dashboards and Analytics:
- Tableau/Power BI: Business intelligence and reporting
- Looker: Modern BI platform for technical teams
- Custom solutions: Internal dashboards using React/D3.js
Best Practices for Engineering Teams
Metric Selection:
- Start with DORA’s four key metrics as a foundation
- Add domain-specific metrics based on architecture
- Avoid vanity metrics that don’t drive decisions
- Regular review and refinement of metric portfolio
Dashboard Design:
- Separate operational dashboards from executive summaries
- Use appropriate visualization types for data characteristics
- Implement drill-down capabilities for root cause analysis
- Ensure mobile accessibility for on-call scenarios
Alerting Strategy:
- Implement tiered alerting based on severity and impact
- Use anomaly detection to reduce false positives
- Establish clear escalation procedures and runbooks
- Regular alert tuning to maintain signal-to-noise ratio
Conclusion: Building a Data-Driven Engineering Culture
As software engineers, you understand that sustained high performance cannot be achieved purely through individual efforts; it requires systematic measurement and continuous optimization. The 20 metrics outlined in this article provide a comprehensive framework for understanding and improving your software delivery capability.
The most successful engineering teams use these metrics to debug their entire software delivery system rather than as individual performance scorecards. By implementing thoughtful measurement practices, you’ll transform your team’s ability to deliver reliable, high-performance software at scale.
The goal isn’t to optimize every metric simultaneously but to create a culture of continuous improvement where data drives engineering decisions, and everyone understands how their work contributes to overall system health and user satisfaction.