Engineering teams often face tight deadlines, complex codebases, and a constant need to improve their workflows. But understanding what’s driving productivity or causing delays isn’t always straightforward. That’s where Git Analytics comes in. It uses data from Git repositories to provide clear insights into how teams are working.
What is Git Analytics?
Git Analytics is a data-driven approach to understand and improve software development processes by analyzing activity within Git repositories. As every commit, pull request, or code review leaves a trail of data on how a team works, Git Analytics tools collect and analyze them to highlight patterns and trends.
How Git Analytics Works
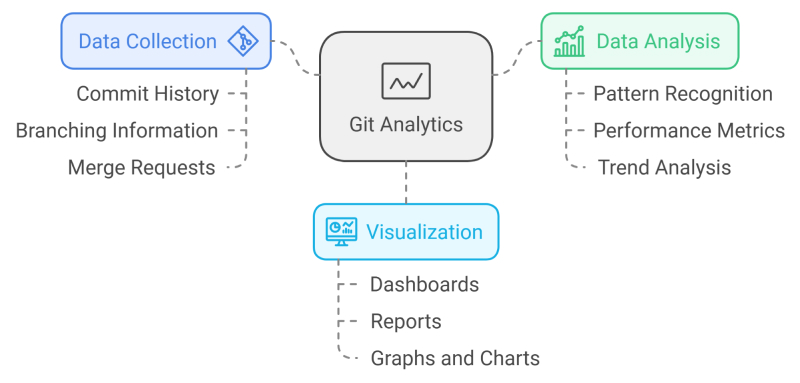
- Data Collection: It pulls data from version control systems like GitHub, GitLab, or Bitbucket.
- Analysis: The data is then analyzed to uncover patterns, such as trends in commit frequency, review times, or deployment success rates.
- Visualization: Finally, the results are presented in dashboards and reports, giving teams an instant performance overview.
But Git Analytics isn’t just about metrics; it’s about context. It tells the story behind the numbers, helping you answer critical questions like:
- Are we committing too many changes without proper reviews?
- Is one team member overloaded with tasks?
- How can we reduce the time from code submission to deployment?
By answering these questions, Git Analytics becomes a guiding light for teams striving to be more productive and collaborative.

How Git Analytics Impacts Teams
- Improved code quality: By analyzing commit history and pull requests, Git Analytics helps identify potential vulnerabilities or areas of the codebase that frequently introduce bugs.
- Streamlined collaboration: Insights into review cycles and contribution patterns make balancing workloads and reducing bottlenecks easier.
- Smarter decision-making: Teams can make decisions based on real data instead of intuition, making every sprint more effective.
Key Metrics to Track with Git Analytics
Not all data is equally valid, and that’s where git metrics come into play. By focusing on the right metrics, teams can identify particular areas for improvement and then track them.
1. Commit Frequency
Commit frequency reflects how often developers push code to the repository.
- Why it matters: Consistent commits often indicate an engaged team, while irregular patterns could indicate blockers or inefficiencies.
- What to watch for: Extremely high commit rates suggest micromanagement. Low commit rates indicate a lack of team activity.
2. Code Review Turnaround Time
This measures how quickly pull requests are reviewed and merged.
- Why it matters: Faster reviews mean shorter feedback cycles and quicker deployments. Delays can slow down the entire development process.
- What to watch for: Long review times may result from unclear reviewer responsibilities, complex code changes, or insufficient staffing.
3. Pull Request (PR) Size
The size of a pull request can make or break a review process.
- Why it matters: Small, manageable PRs are more accessible to review and less likely to introduce bugs. Oversized PRs can overwhelm reviewers and slow down development.
- What to watch for: Encourage splitting large changes into smaller, focused PRs for faster feedback and deployment.
4. Change Failure Rate
This tracks the percentage of changes that lead to failures, such as bugs or regressions.
- Why it matters: A high failure rate suggests problems with testing, deployment processes, or code quality.
- What to watch for: Teams should aim for a low failure rate, balancing speed with stability.
Top Git Metrics Tools for Engineering Teams
With the right git metrics tools, teams can streamline data collection and analysis. Here are some standout tools to consider:
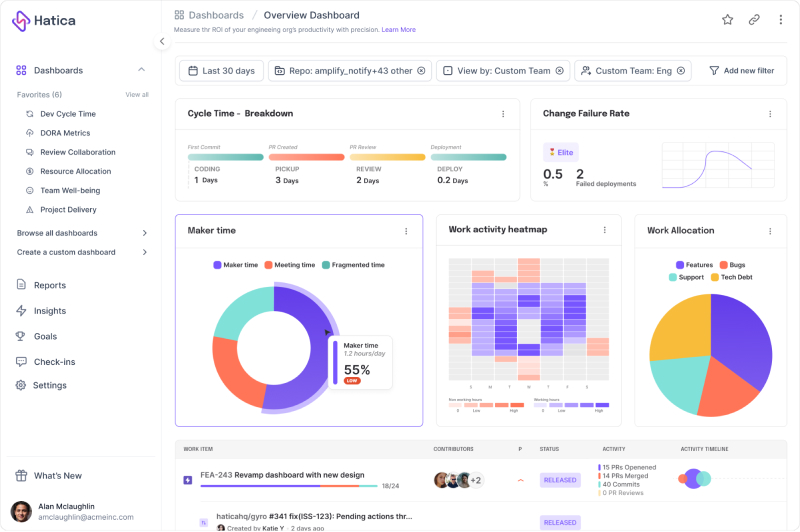
- Hatica: Provides detailed dashboards for monitoring productivity, workflow efficiency, and code quality. Ideal for gaining a clear, actionable overview of team performance.

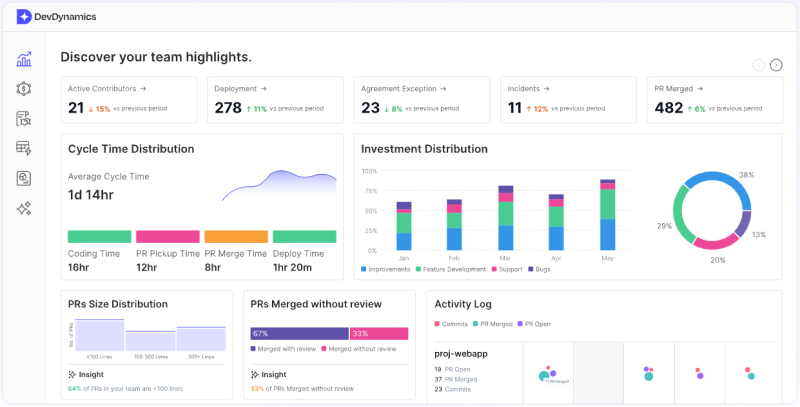
- DevDynamics: Focuses on identifying bottlenecks and inefficiencies. Offers real-time workflow insights to help streamline development processes.

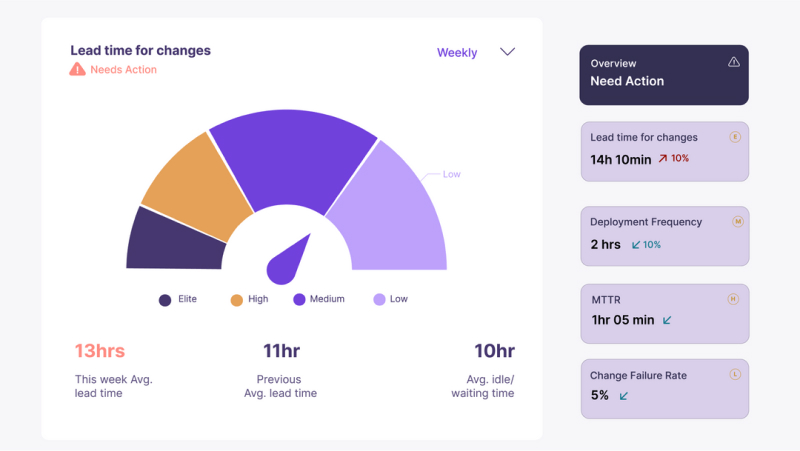
- Opsera: Specializes in advanced metrics like deployment stability and change failure rates. Includes automation pipelines and comprehensive analytics for DevOps teams.

Best Practices for Implementing Git Analytics
- Insights into meetings: Use Git Analytics dashboards to inform stand-ups and retrospectives, turning insights into action.
- Define metrics with purpose: Don’t overwhelm your team with unnecessary data. Focus on the metrics that align with your goals.
- Encourage transparency: Share Git insights openly. When everyone understands the numbers, it fosters accountability and teamwork.
Conclusion
Git engineering is a game-changer for engineering teams. It provides the data needed to make smarter decisions and improve workflows. By tracking the right metrics, teams can enhance productivity, code quality, and collaboration.
Whether a small team or a large enterprise, Git Analytics can help you understand your processes and continuously improve. Start simple, choose the right tools, and let data guide your next steps. Take control of your team’s performance today and see the difference Git Analytics can make.
