Every system faces issues. But the quicker they are detected, the easier they are to fix. Mean time to detect (MTTD) helps measure how long it takes to find a problem after it happens.
What is Mean Time to Detect (MTTD)?
Mean time to detect (MTTD) is a key measure in many fields, including IT, security, and operations. It measures how long it takes to find a problem after it occurs. The faster a company spots an issue, the quicker it can be fixed, saving time and money.
Businesses use MTTD to check how well their systems can identify issues. Problems might be detected by automated tools or reported by users. Either way, a lower MTTD means quicker responses and fewer losses.
How to Calculate MTTD
The formula for MTTD is:

Example:
An IT team experienced six system failures in a month, with a total time from failure to detection of 600 minutes.
MTTD = 600/6 = 100 MinutesSo, on average, issues were found 100 minutes after they started.
Lower MTTD values indicate issues are detected early, and higher MTTD values show delayed detection, which can lead to longer downtime and higher costs.
Why Keeping a Low MTTD is Important
A lower MTTD helps businesses run smoothly. Here’s why:
- Less downtime : Fixing issues faster keeps everything running.
- Better security : Early threat detection prevents serious damage.
- Happier customers : Fewer delays mean better service.
- Efficient operations : Teams react quickly and avoid long disruptions.
- Cost savings : The longer a problem stays undetected, the more expensive it is to fix.
Industry Standards for MTTD
The MTTD industry standards vary based on the fields.
- Cybersecurity : MTTD should be in minutes or hours to catch threats before harm is done.
- IT system issues : A good MTTD is under 30 minutes to avoid major disruptions.
- Manufacturing and logistics : MTTD should be as low as possible to prevent shutdowns.
- Healthcare systems : Faster detection is crucial as delays affect patient care and safety.
Factors Affecting MTTD
Several factors impact an organization’s MTTD:
- Quality of monitoring tools : Advanced AI-based monitoring detects issues faster than manual observation.
- Staff expertise : A well-trained team responds more effectively to alerts and anomalies.
- Data logging and analysis : Strong log management helps identify patterns and anomalies sooner.
- Communication process : Poor internal reporting can delay detection.
- Incident response automation : Automated responses can significantly lower MTTD by reducing the need for manual intervention.
Examples of MTTD in Action
Example 1: IT system outage
An online store’s system crashes at 2:00 AM. Their monitoring tool spots the issue by 2:05 AM and alerts the IT team. MTTD = 5 minutes. This is excellent because the team can act before customers notice.
Example 2: Security breach
A bank experiences an unauthorized login at 3:45 PM, but the security team doesn’t detect it until 6:30 PM. The MTTD is 165 minutes. This delay increases the risk of data theft. A lower MTTD would have helped reduce the impact.
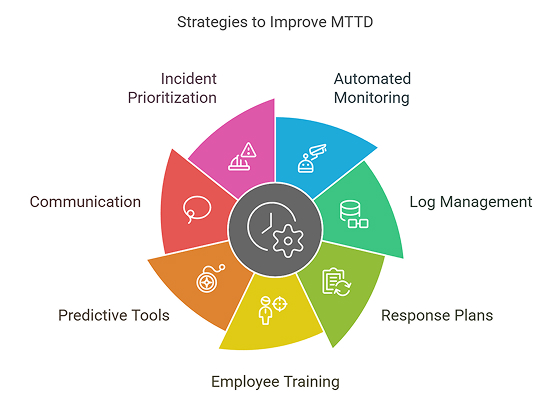
How to Improve MTTD
Businesses can achieve lower MTTD values by following these steps:

- Use automated monitoring : AI and real-time alerts help find issues instantly.
- Improve log management : Tracking system logs makes it easier to detect problems.
- Set clear response plans : Teams should have structured workflows for handling incidents.
- Train employees : Regular security drills improve response times.
- Use predictive tools : Machine learning can help spot issues before they happen.
- Enhance internal communication : Clear reporting helps detect incidents faster.
- Prioritize incidents by tier : Separating critical failures from minor ones ensures faster detection of high-impact issues.
Comparing MTTD with Other Metrics
MTTD works alongside other key performance indicators (KPIs) to provide a complete picture of system performance. Some common related KPIs include:
- Mean time to recovery (MTTR) : The average time to recover to normal operations after an incident or system failure.
- Mean time between failures (MTBF) : The duration a system functions before failing.
- Downtime percentage : How often systems are not working in a set time.
- Mean time to acknowledge (MTTA) : Measures the time it takes for the team to acknowledge an issue after detection.
Tracking MTTD with Data
Using graphs and tables helps businesses spot trends and track improvements.
Example: Monthly MTTD comparison

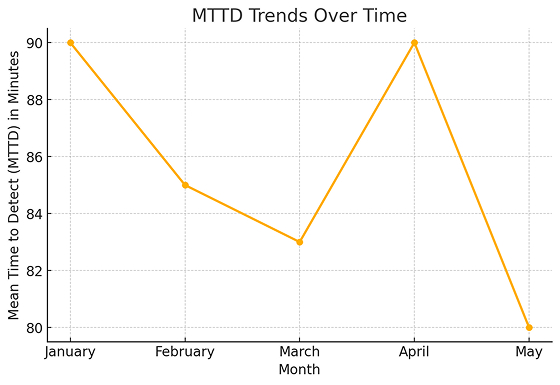
From this table, a business can see if MTTD is improving or getting worse. A line graph could also show trends over time.
Visualizing MTTD Trends
Organizations often use line graphs to track how MTTD changes over time. Here’s what to look for:

- A downward trend : Shows improvement in incident detection speed.
- Spikes : Could indicate specific problems in certain months.
- Seasonal patterns : Some businesses experience higher MTTD during peak seasons.
Final Thoughts
Tracking and improving the mean time to detect KPI is key for keeping businesses secure and efficient. By using intelligent tools, automation, and precise response plans, companies can lower their MTTD and improve overall performance.
Reducing MTTD saves money, prevents damage, and keeps services reliable. In IT, cybersecurity, or manufacturing, a low MTTD is always better.
A strong incident response strategy starts with quick detection. The faster an issue is identified, the sooner it can be fixed. Companies that focus on reducing MTTD build stronger, more resilient systems and gain a competitive advantage.

