Mean Time to Repair (MTTR) is a reliability metric that answers one question: “How long does it take us to get back to normal after something breaks?”
For a microservice platform or SaaS product, MTTR translates raw incident minutes into a number that can be discussed in status pages, post-incident reviews, and SLO reports.
What is Mean Time to Repair (MTTR)?
MTTR is the average time from detecting a service outage (i.e., an alert, failed health‑check, or user ticket) to fully restoring normal behavior and verifying it with automated tests or monitors.
The clock starts when a valid signal, such as an alarm on a production line, a failing health check in Kubernetes, or a user ticket, confirms that performance is out of spec. It stops once the asset meets its functional criteria and any required verification checks have passed.
Why Does a “Low” MTTR Matter?
MTTR adds up every minute lost during an incident from the alert, through diagnosis and rollback or redeploy, to the final health check that says, “we’re good.” By rolling all those steps into one number, anyone can see at a glance how long it really takes your service to bounce back.
The benefits of a low MTTR include:
- Revenue protection: Each minute of API downtime can result in a drop in conversion, ad impressions, or subscription renewals.
- SLA compliance: Many cloud contracts refund customers if cumulative incident minutes exceed a threshold.
- Team efficiency: The shorter the median repair window, the less context-switching and overtime.
- Engineering feedback loop: MTTR trends reveal whether observability, runbooks, and deployment automation are actually improving recovery.
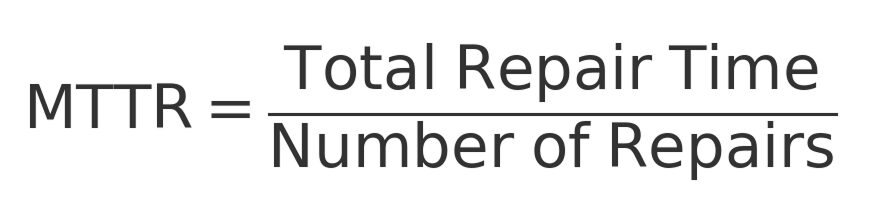
How to Calculate MTTR
The MTTR formula is easy, but you must decide exactly when the timer starts and stops.
- Option 1: Start the timer as soon as the problem is detected (includes detection time).
- Option 2: Start the timer only when repair work begins, and track detection time separately as MTTD.
Software teams often separate the two because monitoring can improve on its own. Factory teams often combine them because operators notice failures right away.
Whichever rule you pick, write it down and teach everyone. If the rule changes from year to year, your MTTR trend will fluctuate for reasons unrelated to actual performance.
How to Reduce Mean Time to Repair
- Tighten alerting: Use fine-grained health checks and route alerts instantly to chat/pager so remediation starts within seconds.
- Automate rollbacks: Keep one-click scripts or blue-green toggles ready to revert the last deploy without manual steps.
- Centralize observability: Aggregate logs, traces, and metrics in one dashboard, complete with correlation IDs to jump straight to the root cause.
- Pre-approve emergency actions: Allow on-call engineers to roll back or flip feature flags without waiting for managerial sign‑off.
- Run game-day/chaos drills: Practice failure scenarios regularly; each drill exposes and fixes hidden delays before they become real incidents.
- Automate smoke tests: After every rollback or redeploy, trigger fast end-to-end tests (login, checkout, core API) to confirm the fix and stop the clock quickly.
Benefits of Measuring MTTR
Tracking downtime alongside MTTR gives many opportunities for improvements.
- Protects revenue: Every minute an API, checkout page, or auth service is down costs money. A visible MTTR trend ties minutes lost directly to dollars at risk.
- Keeps SLAs/SLOs healthy: Median and 90th-percentile MTTR help forecast error-budget burn and avoid contract penalties or release freezes.
- Optimizes on-call rotations: Knowing that “90% of incidents close in < 20 min” lets managers build leaner, less fatiguing schedules without sacrificing coverage.
- Targets automation spend: When reports show most downtime is spent on manual DB migrations or env rebuilds, that evidence justifies tooling budgets.
- Boosts team morale: A shrinking MTTR graph proves observability and runbook efforts work, reinforcing a learning culture.
- Builds customer trust: Publishing a brisk MTTR in status-page post-mortems signals operational maturity to prospects and auditors.
Challenges When Measuring MTTR
Capturing a clean, comparable MTTR sounds simple. But real‑world data can be messy. Watch out for these common pitfalls:
- Unclear timer boundaries: Different people start/stop the clock at different points, making trends meaningless.
- Missing timeline stamps: Absent “acknowledged,” “mitigation,” or “resolved” timestamps break the calculation.
- Outlier distortion: A single multi‑hour outage can skew the monthly mean; always chart median and P90 as well.
- Mixed severities/services: Bundling minor blips with full‑cluster failures hides high‑risk weaknesses in the segment first.
- Manual data gaps under stress: Engineers skip timestamps during firefights; provide one‑click logging inside the incident chat.
Conclusion
You can’t stop every incident. However, you can control how long it takes to bounce back. A high MTTR drains revenue, burns error budgets, and wears down your team.
Measuring MTTR allows you to clearly identify what brings you down. It can be slow alerts, unclear steps, manual fixes, pending approvals, etc. Every minute you save by removing these blockers means more uptime, happier users, and a team that continues to improve.