Which Git metrics are most useful for tracking team performance?
Written by

Status
answered
Written by
Status
answered
Every engineering team faces the same challenges: work stalls in review, quality regressions enter production, and key knowledge becomes concentrated in a few individuals. Git-hosted work already records almost every action we take; the trick is to turn them into insights you can act on.
Here’s a concise set of Git metrics, each paired with the specific problem it uncovers. Use it to choose the performance measures that will matter most to your team.
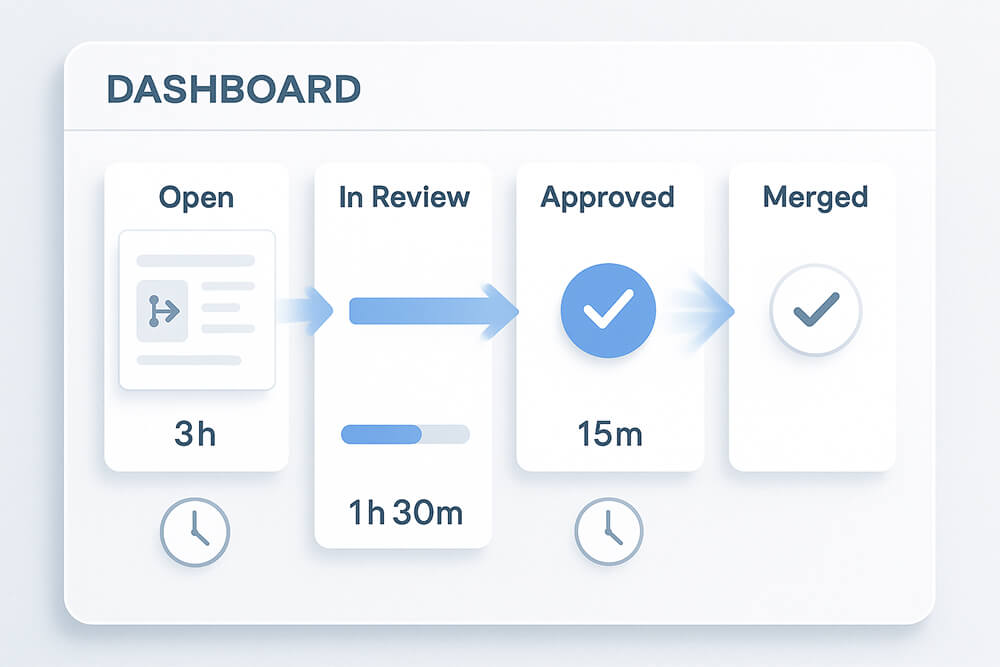
These Git metrics show where code waits between typing the last line and merging the PR. Reducing these waits helps you cut overall lead time without touching the code itself.
Break the clock into three slices so you know which hand-off drags:
Median and 95th percentile changed-line counts reveal if work remains manageable. Around 300-400 lines keep reviews sharp. PRs exceeding 1,000 lines can be overwhelming for reviewers.
A PR untouched for 7-10 days is a half-done feature. Persistent high WIP means you start tasks faster than you finish them. You need to tighten the “definition of done” or cap parallel work.
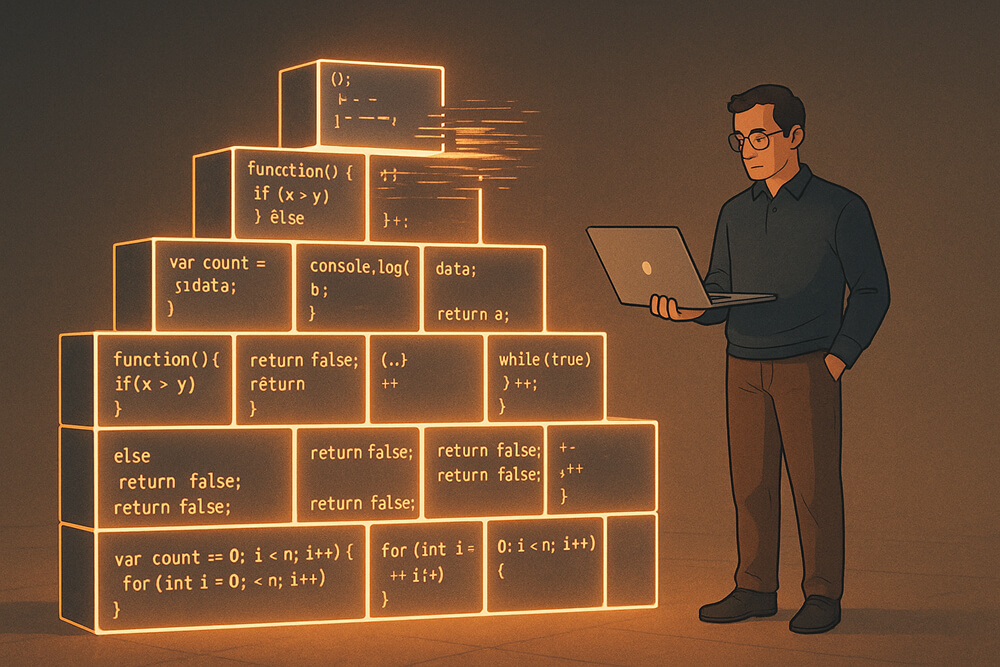
These signals flag fragile code and shaky releases. Track them to catch issues sooner and regain confidence after every merge.
Keep track of the percentage of PRs that got at least one review. Add a reviewer from a different team for risky areas. Use a concise PR template to document the risk, tests, and procedures for reverting if necessary.
Check the % of lines that changed again in 14 to 30 days. If churn increases, it’s often because the requirements are unclear, the design is flawed, or the merge is happening too quickly.
Count how many times things roll back each week or month. Spikes usually point to missing tests, PRs that are too big, or unsafe release steps.
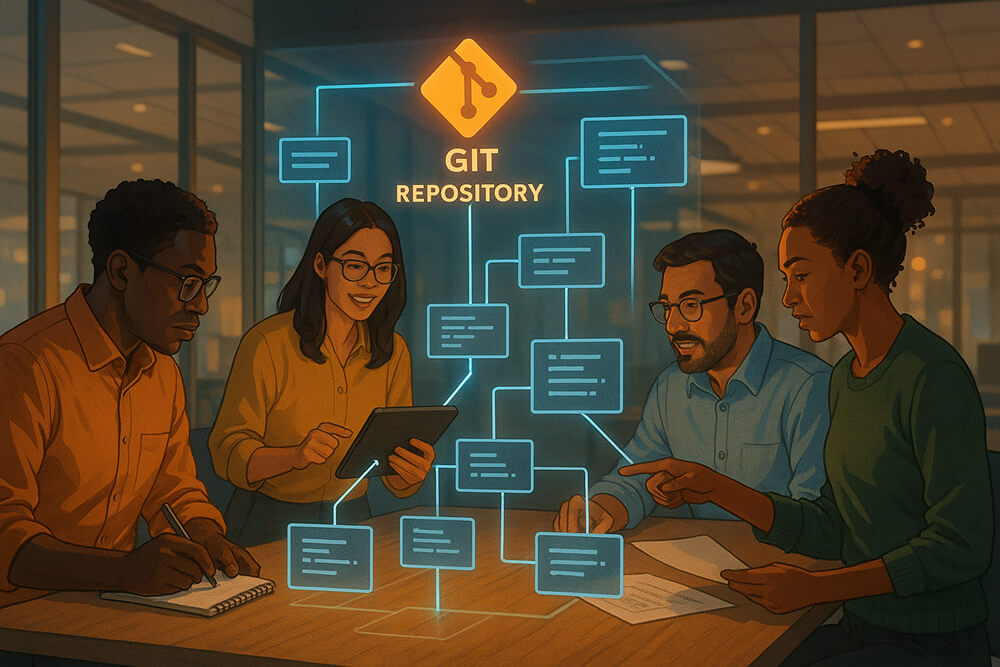
These Git analytics highlight single points of failure and invisible queues. Fix them to spread context, reduce review bottlenecks, and maintain a low bus factor.
If a single author owns more than 70% of the recent changes in a file, it is considered a high-risk file. It is recommended to rotate pairing, schedule code walkthroughs, and expand CODEOWNERS to reduce this risk.
Chart reviews given per engineer. If two names handle half the queue, the team gains speed only if both of those people are free. Rotate a “reviewer-on-duty” role daily or per sprint, or automate reviewer assignment with rules like “pick one domain expert and one recent contributor.”
A PR that edits five directories might signal a feature cutting across clear boundaries-or that those boundaries no longer exist. Over time, such spider-web changes increase merge conflicts and cognitive load.
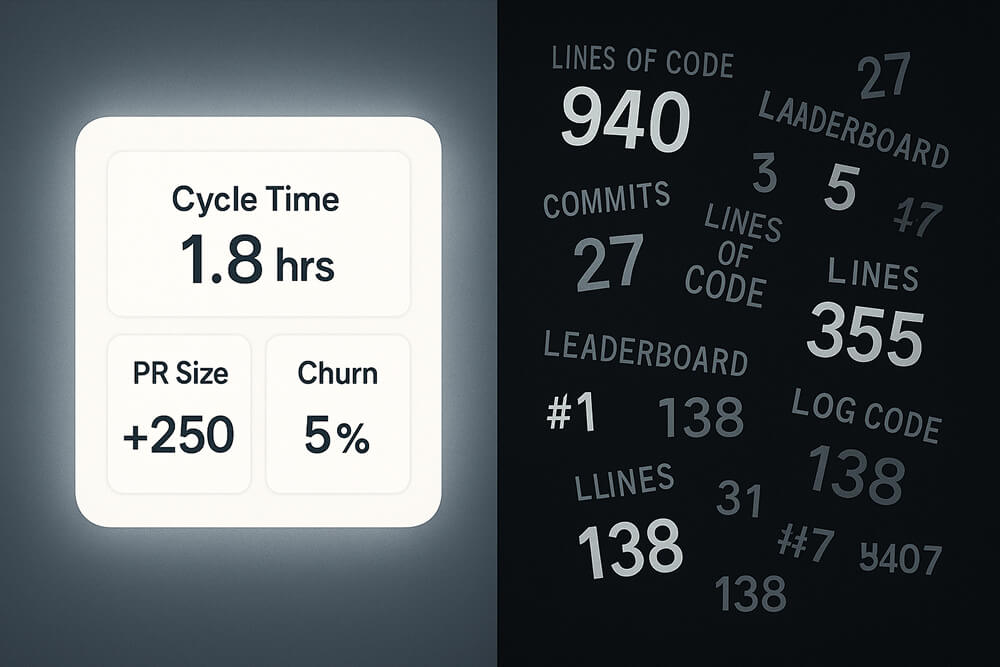
These numbers are popular because they’re trivial to count. Unfortunately, they often nudge behaviour in the wrong direction. Track them if you want, but park them in a corner of the dashboard and never base rewards or reprimands on them.
Large diffs often feel productive yet can lead to duplication or verbosity. LOC can estimate long-term maintenance costs, but it can’t judge the value of a change.
Ten “fix typo” commits can easily increase this count. Developers quickly learn to split work into noise rather than substance. Use commit frequency only to spot outliers (e.g., someone suddenly silent for a week).
Public scoreboards push people to game the metric, flooding the repo with micro-PRs or low-value comments to climb the chart. Over time, this erodes trust and collaboration. Focus on team-level trends instead.
Great engineering culture isn’t built on dashboards; it’s built on habits those dashboards nudge:
Keep any metric that sparks conversation and drives a concrete practice. Drop anything that slips into personal scoring. Do that, and you’ll feel delivery smooth out long before every widget turns green.

