How often should we measure DevEx?
Written by

Status
answered
Written by
Status
answered
Developer Experience (DevEx) is the sum of everything that helps or hinders engineers while they design, code, test, and ship software. Large-scale DevEx research tracking tens of thousands of developers across hundreds of companies suggests that even a one-point improvement in perceived developer effectiveness can reclaim meaningful time each week, adding up to several productive hours per engineer per year. Better DevEx correlates strongly with higher productivity, faster delivery, and improved retention, making it essential to measure it intentionally rather than treating it as an intangible “feel-good” factor.
Focus on a balanced mix of flow and delivery indicators (such as DORA metrics), collaboration signals (PR size and review latency), tooling and environment health (build success, CI/CD reliability, and environment setup), and developer sentiment (pulse surveys, eNPS). Tracking all four angles prevents you from chasing a single “vanity” number and gives a full picture of the developer journey.
Tracking a balanced basket keeps teams from obsessing over a single vanity metric while ignoring the wider developer journey.
Collect too little data, and you miss slow-creeping bottlenecks, but collect too much, and engineers drown in dashboards instead of writing code. Recent DevEx reviews show that teams often default to “easy-to-pull” numbers that update constantly, while overlooking slower-moving factors that actually predict retention and output. Choosing a well-calibrated cadence prevents alert fatigue and ensures every data point feeds an actionable decision.
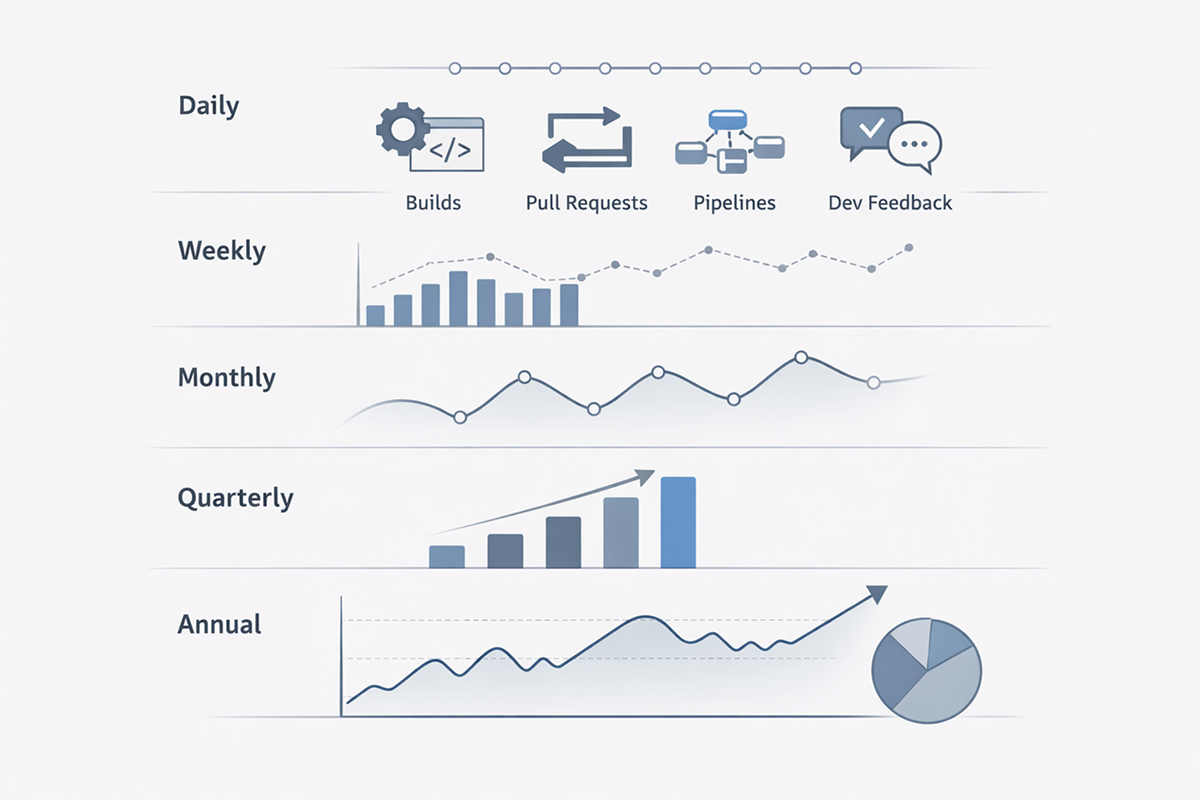
Use a layered cadence: daily automated checks for build and pipeline health, weekly reviews for sprint-level frictions, monthly snapshots for trend-lines and satisfaction, quarterly audits for strategic questions, and annual benchmarking against industry peers. This rhythm supplies fast feedback without overwhelming engineers.
Automated indicators that affect the day-to-day flow, build success rate, CI/CD queue length, and production incidents should be refreshed daily. Continuous visibility lets on-call or platform teams unblock colleagues before defects snowball.
Metrics tied to sprint rhythms, such as average PR review time or the count of open PRs older than 48 hours, reveal emerging friction when viewed weekly. A short weekly retro can address these before they harm the next sprint’s goals.
For initiatives that need a little breathing room, cycle-time trends, developer satisfaction snapshots, or adoption of a new internal service, monthly reviews strike a balance between signal and noise. Many organizations present DevEx scorecards to leadership on this cadence.
Strategic questions (e.g., “Did the new monorepo decrease cognitive load?”) warrant quarterly reflection. Analysts recommend starting with quarterly DevEx audits and transitioning to monthly once a stable baseline is in place
Once a year, compare internal DevEx trends against external benchmarks, assess culture surveys, and confirm that tooling investments remain aligned with company strategy. Annual reviews spotlight long-term ROI and feed the next fiscal roadmap.
Numbers explain what is happening; conversations explain why. Pair dashboards with interviews, focus groups, or post-sprint pulse questions so teams understand the human reasons behind metric shifts. A 30-day DevEx audit framework, for instance, combines metric baselines with developer interviews to prioritize the highest-impact fixes.
Start by establishing a baseline, then automate data collection, co-design metrics with developers, visualize trends (not raw counts), and revisit cadence as processes mature. The goal is to turn every metric into a conversation that drives concrete improvements, not dashboard clutter.
DevEx metrics are only useful when they close a loop: observe, discuss, improve, re-measure. A layered cadence, daily visibility, weekly tactical checks, monthly trend analysis, quarterly strategy, and annual benchmarking create just enough touchpoints to keep experience front-of-mind without overwhelming engineers. By treating measurement itself as a living process, organizations continuously refine both the developer journey and the business outcomes it powers.

