How can sprint metrics help identify bottlenecks in the development process?
Written by

Status
answered
Written by
Status
answered
Software development emphasizes delivering superior features to customers within a short period. Thus, teams are focused on enhancing their delivery methods on an ongoing basis. This is where sprint review (or developer productivity) metrics come in. These metrics offer relevant details on productivity, task completion rates, quality control, and other aspects of the development process. As a result, they assist in identifying potential areas for improvement in the delivery processes, analyzing the underlying problems, and devising solutions.
For example, assume a team notices a drop in velocity from 25 to 15 story points in two consecutive sprints and an increase in unplanned work. These numbers provide an early indicator of unclear requirements and scope creep, which might lead to bottlenecks. Since the team detects it early, they can quickly mitigate it by improving backlog grooming sessions and enforcing stricter WIP limits.
Likewise, analyzing these metrics can pinpoint specific issues in your workflows, such as:
Now, let’s see the sprint metrics we can use to identify bottlenecks and how to do so.
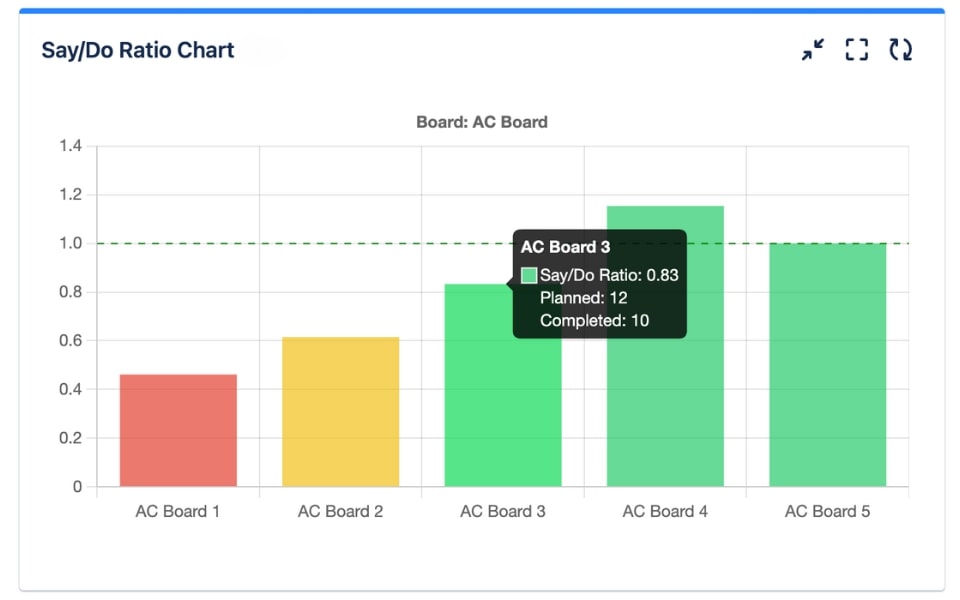
The Say/Do Ratio measures the percentage of work a team completes compared to what was initially planned. It is calculated as:
Say/Do Ratio (%) = (Completed Story Points / Planned Story Points) * 100
Example:
Say/Do Ratio = (30 / 40) * 100 = 75%
Insights:
Tools: Jira and Azure DevOps provide built-in reports for Say/Do Ratios.
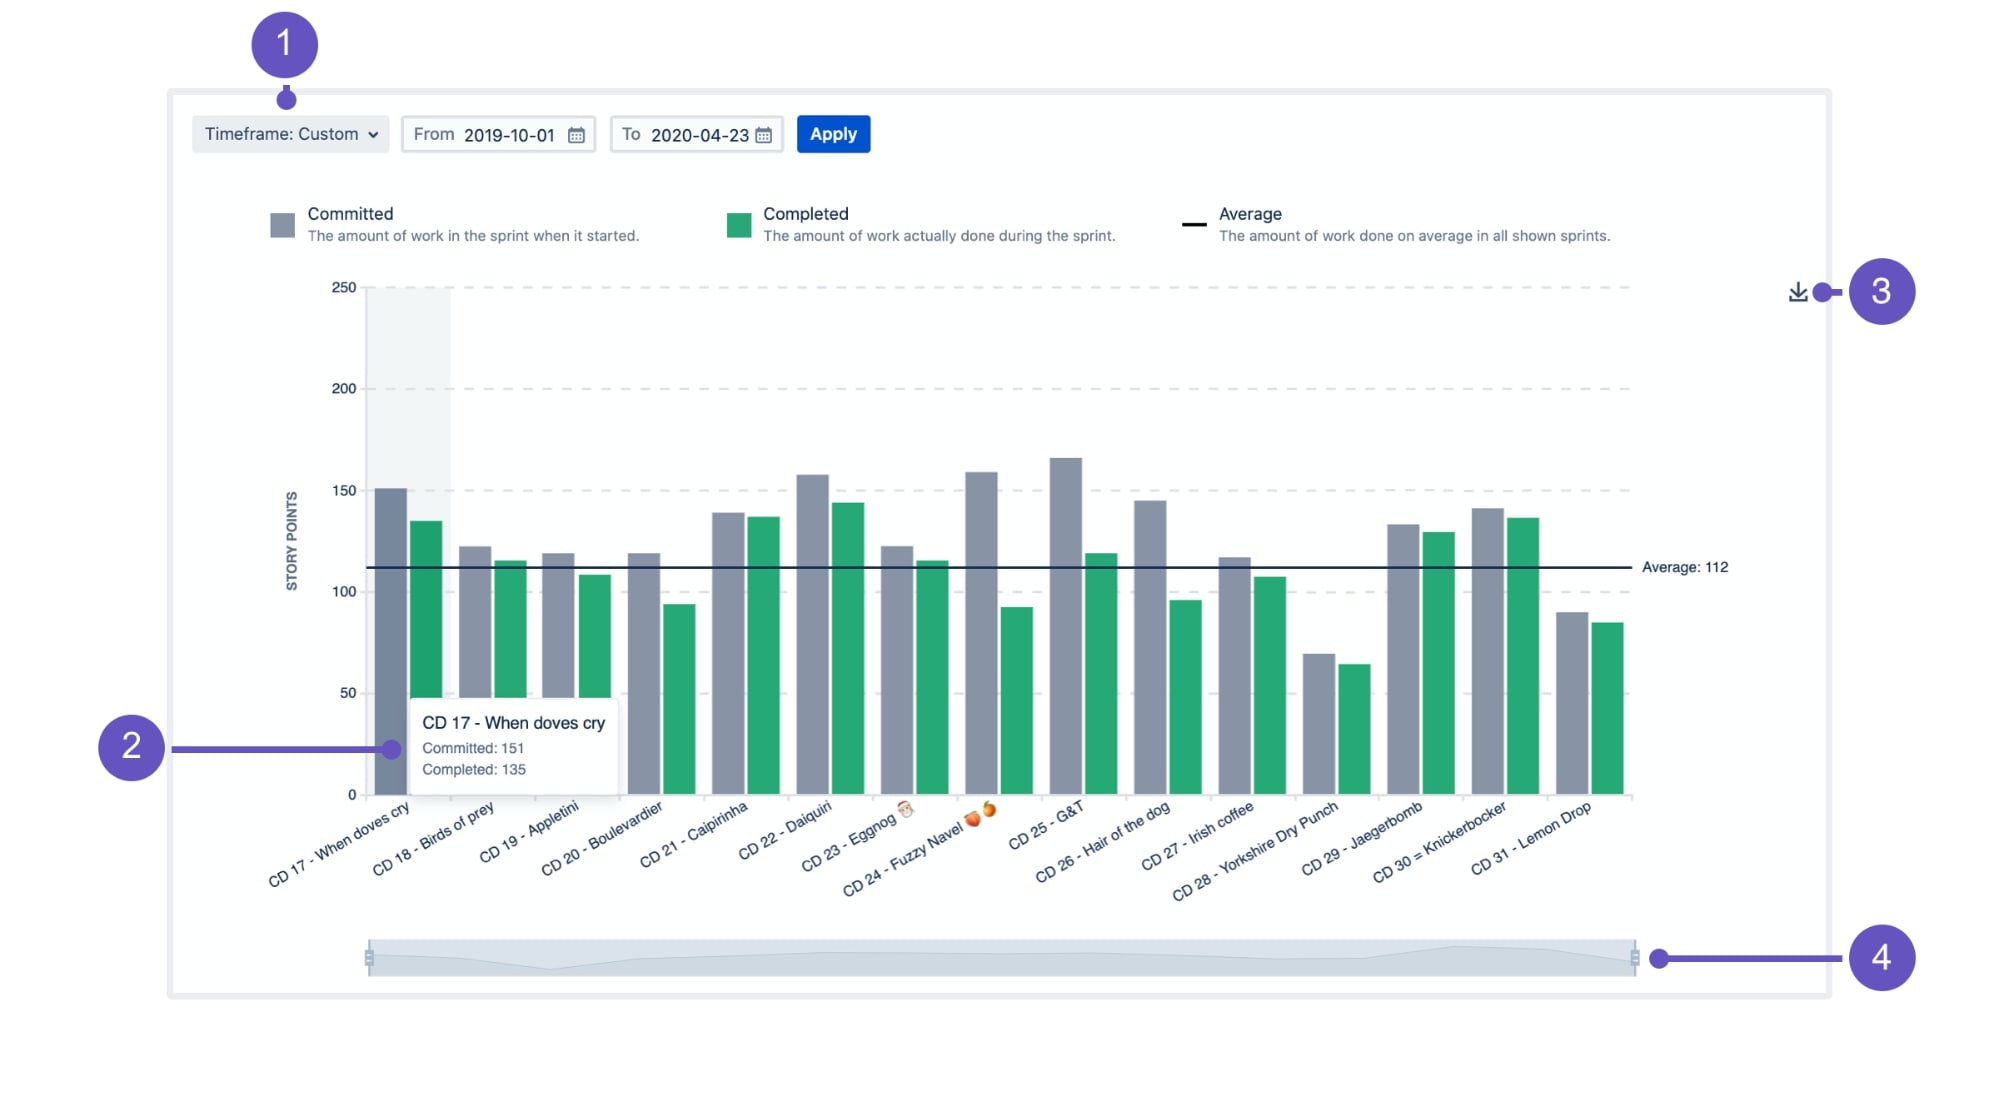
Sprint Velocity measures the average amount of work completed in a sprint. This is usually measured in story points and helps teams estimate future workloads.
Velocity = Total Story Points Completed / Number of Sprints
Example:
Velocity = (20 + 25 + 22) / 3 = 22.33 points
Insights:
Tools: Sprint velocity charts are available in Jira, Monday.com, and ClickUp.
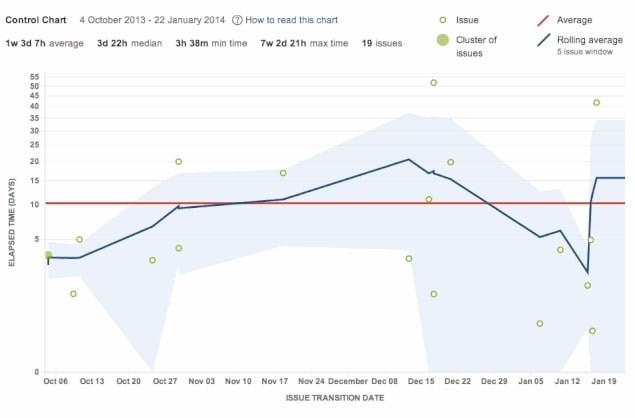
Cycle Time measures the time taken to complete a task from start to finish. It identifies delays in the development process.
Cycle Time = End Date – Start Date
Example:
If a feature begins on January 1st and ends on January 10th, the cycle time will be
Cycle Time = 10 – 1 = 9 days
Insights:
Tools: Trello, Jira, and Asana visualize cycle time through kanban boards.
WIP Limits control the number of tasks a team can handle simultaneously, reducing context switching and inefficiencies.
Example:
Tools: Kanban tools like Jira, Kanbanize, and Monday.com allow WIP limits to be set and tracked.
Lead Time calculates the total time taken from task creation to delivery. It highlights bottlenecks in task progression.
Lead Time = Completion Date – Creation Date
Example:
A task created on February 1st is completed by February 15th.
Lead Time = 15 – 1 = 14 days
Insights:
Tools: Tools like LeanKit and Jira visualize lead times with cumulative flow diagrams.
Unplanned Work Percentage measures the volume of unexpected tasks added during a sprint.
Unplanned Work (%) = (Unplanned Tasks / Total Tasks) * 100
Example:
Unplanned Work = (5 / (20 + 5)) * 100 = 20%
Insights:
Tools: Jira backlog reports and Sprint Reports track planned vs unplanned tasks.
Sprint metrics or developer efficiency metrics allow teams to track performance and identify bottlenecks in their development processes. You can easily capture and monitor these metrics through tools like Jira and Azure DevOps to ensure continuous improvement, leading to better quality and faster delivery.
Written by

Status
answered
Written by
Status
answered
Written by

Status
answered