Ask three teams what “efficient engineering” means and you’ll get three different answers. One will talk about shipping faster. Another will say “fewer incidents.” A third will insist it’s all about focus time. They’re all right. Engineering efficiency is the balance of pace, quality, and predictability.
Therefore, it is crucial to understand how to accurately measure engineering efficiency.
Start with outcomes, then work backward
Before you open a dashboard, write down the outcomes you actually want this quarter. Examples:
- “Ship the mobile redesign by the 20th of next month.”
- “Reduce on-call pages outside working hours by half.”
Once outcomes are clear, pick engineering efficiency metrics that explain movement toward those outcomes. Select a coherent set of metrics, as a single metric won’t fully capture performance.
Core Efficiency Scorecard
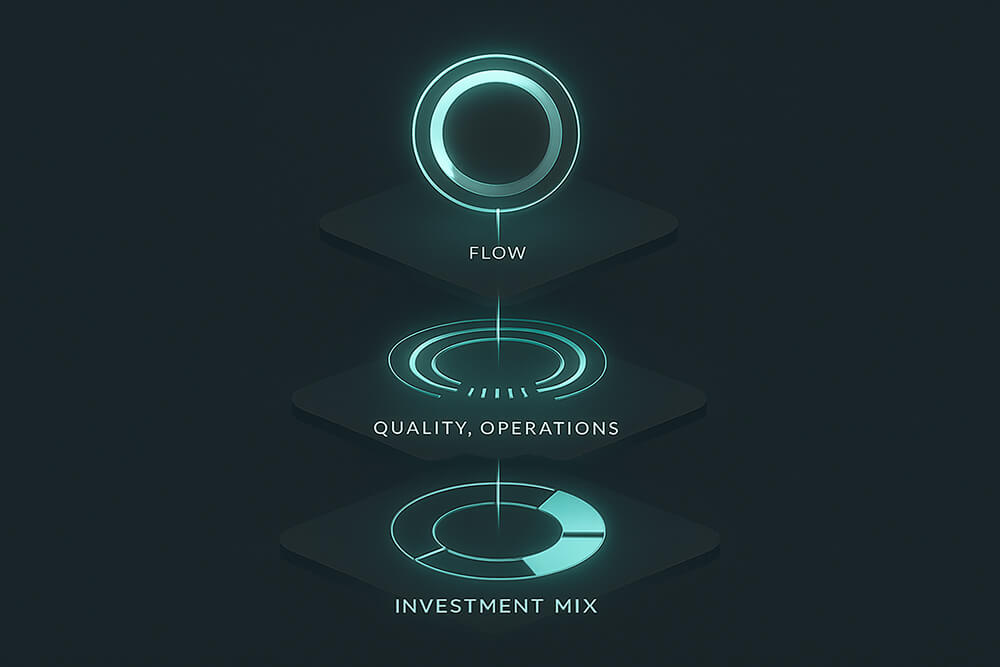
Think in three layers: flow, quality/operations, and investment mix. This keeps engineering productivity tied to real work.
Flow
- Lead/Cycle time (median & p90): From first commit (or ticket start) to production. Break it into “time to first review,” “time in review,” and “time after approval.”
- Deployment frequency: How often you deploy to production. Aim for smaller, frequent releases, like weekly.
- Work-in-progress: Open PRs per engineer and age of open branches.
Quality & Operations
- Change failure rate: Percentage of deploys that cause rollbacks and hotfixes.
- MTTR: Time from incident start to restoration (or mitigation, if that’s your chosen definition—be consistent).
- Defect escape rate: Bugs found after release vs. pre-release.
Investment Mix
- Where time goes: New features vs. maintenance vs. platform/infra vs. toil pay-down.
- Review load balance: Having a couple of senior devs handle all the reviews creates a hidden queue.
Instrumentation and Data Sources
You likely already own most of the data.
- PRs & Git: Timestamps for open/first review/approve/merge; diff size; files touched.
- CI/CD: Build durations, queue times, deploy success/failure, and rollback tags.
- Issue tracker: Work start/finish; labels for bug/feature/platform; blocked states.
- Incidents: Start/stop, severity, customer impact, remediation follow-ups.
Pipe this to something simple first (a spreadsheet or a lightweight BI view). Fancy engineering performance metrics tooling can come later.
Interpreting the Signals
- Prefer medians and p90s. Averages hide pain. If your p90 cycle time is three weeks, someone’s waiting.
- Compare cohorts. A “before/after” view of one repository or squad beats cross-team league tables.
- Watch deltas. “Cycle time down 18% over six weeks” is actionable; “our cycle time is 3.2 days” is trivia.
- Annotate events. Note when you changed branching strategy, added reviewers, or split a service. Correlate those changes with the curves.
Governance and Safeguards

A few habits keep measurements honest and human:
- Measure work, not people. Evaluate code, not coders. Team-level metrics curb gaming and ease anxiety.
- Balance speed with stability. More deployments only count as progress if the change failure rate remains stable or decreases.
- Cap PR size. Aim for changes a reviewer can absorb in a single sitting. Oversized diffs are the leading cause of review delays.
Examples that Actually Move the Needle
- Cut PR wait time: Add a Slack reminder at 90 minutes of idle time, rotate a “reviewer of the day,” and limit PRs to ~300–400 lines. Re-measure in two weeks.
- Shorten cycle time: Fail fast on flaky tests (quarantine list, daily fix quota); parallelize CI; auto-label PRs needing a second reviewer.
- Stabilize releases: Use a release train (fixed windows), automatic deployment notes, and a clear rollback script. Pair that with a blameless incident review that produces one small, automated guardrail each time.
What to Avoid
- Tracking “commits per engineer.” It’s a vanity stat that punishes thoughtful work and rewards churn.
- Giant KPI catalogs. Five crisp metrics beat fifteen that no one reads.
- Tool sprawl. Pick one source of truth for each data type and stick to it.
The Takeaway
Measuring engineering productivity metrics isn’t about surveilling developers. It’s about understanding flow, protecting quality, and giving teams room to do their best work. Keep the scoreboard concise, ensure the data is trustworthy, and use it to conduct small experiments. If the work feels smoother and releases feel boring (in the best way), your measurement system is doing exactly what it should.


