Have you ever thought about how popular streaming platforms like Netflix allow thousands of users to watch 4K videos simultaneously without buffering?
The secret is throughput-how many transactions your application processes per second.
Whether launching an e-commerce sale or streaming live video, maximizing throughput ensures your software doesn’t buckle under pressure. This guide dives deep into throughput testing, TPS performance testing, and actionable strategies to measure and optimize throughput.
What is Throughput Testing?

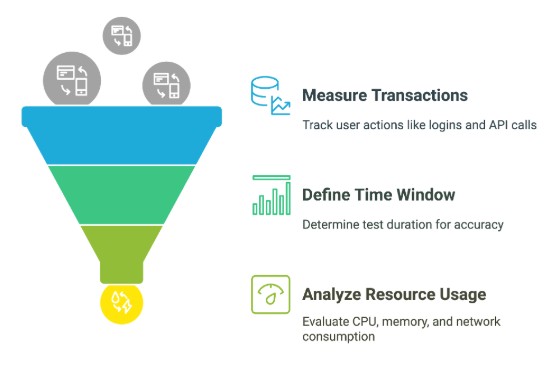
Throughput testing measures how many transactions per second (TPS) a system completes. For example, a banking app might track how many payments it processes during peak hours. Key metrics include:
- Transactions processed: User actions like logins, API calls, or database queries.
- Time window: Test duration (e.g., 5 minutes vs. 1 hour).
- Resource usage: CPU, memory, and network consumption.
“Throughput testing isn’t just about speed-it’s about sustainable performance under real-world stress.”
Step-by-Step Guide to Measure Throughput

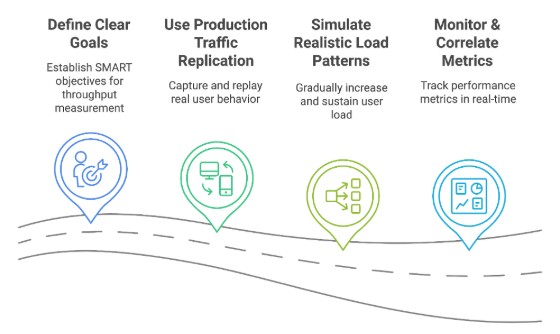
1. Define Clear Goals (SMART Framework)
- Specific: Measure checkout API throughput during peak loads.
- Measurable: Define the appropriate TPS count based on your requirements (e.g., target 2,000 TPS with <100ms latency).
- Achievable: Align with current infrastructure (e.g., 10-node Kubernetes cluster).
- Relevant: Focus on user-critical paths (e.g., payment processing).
- Time-bound: Test in 30-minute intervals to simulate real-world spikes.
2. Use Production Traffic Replication
Replicating actual user behavior is critical. Tools like Speedscale simulate production traffic in Kubernetes, mimicking actual usage patterns. For example:
- Record traffic: Capture API calls, database queries, and user sessions from production.
- Replay traffic: Simulate 10,000 concurrent users using historical data.
- Isolate dependencies: Use automatic mocks for third-party services (e.g., payment gateways).
Example: A ride-sharing app replayed a 24-hour traffic snapshot to test surge pricing algorithms.
3. Simulate Realistic Load Patterns
- Ramp-up: Gradually increase users (e.g., 100 → 500 users over 5 minutes).
- Sustained load: Test long-term stability (e.g., 1,000 TPS for 1 hour to catch memory leaks).
- Spike testing: Inject 5,000 users in 1 minute to test autoscaling (e.g., AWS autoscaling groups).
4. Monitor & Correlate Metrics
Application performance monitoring is essential for tracking real-time usage within an application. Tools such as Grafana and Datadog can be used for this purpose.
- Throughput vs. latency: Rising TPS with stable latency indicates good performance.
- Resource usage: Optimize the code or scale resources if the CPU load is more than 80% or if there are memory leaks.
- Error rates: HTTP 500 errors signal backend issues.
Use distributed tracing (e.g., Jaeger) to pinpoint slow microservices.
Key Considerations for Accurate Testing

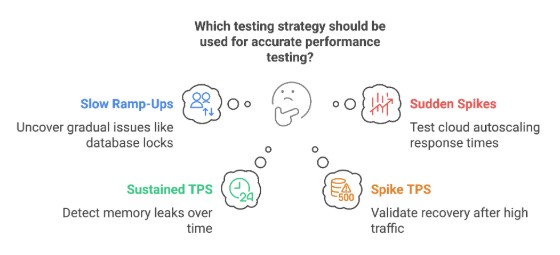
1. Ramp Patterns Matter
- Slow ramp-ups (e.g., +100 users/minute) uncover gradual issues like database locks.
- Sudden spikes test cloud autoscaling response times (e.g., autoscaling from 5 to 50 nodes).
2. Sustained vs. Spike TPS
- Sustained TPS:
- Use case: Detect memory leaks in the application.
- Example: A SaaS platform found a 20% memory leak after 2 hours of sustained 1,000 TPS.
- Spike TPS:
- Use case: Validate recovery after a viral social media post.
- Example: A news website crashed at 3,000 TPS but recovered after optimizing CDN caching.
Tools & Best Practices
Tools for Software Throughput Testing
- JMeter: Open-source tool for HTTP/API load testing.
- Gatling: Scala-based tool with detailed reports.
- Speedscale: Replays production traffic in Kubernetes with automated mocks.
Best Practices
- Test in staging & production: Staging identifies most issues, while production uncovers unexpected real-world scenarios.
- Automate tests in CI/CD: Run hourly tests for critical services (e.g., payment gateways).
- Document everything: Document test configs, results, and fixes.
Common Pitfalls & Fixes
- Testing with stale data: Use fresh, anonymized production data.
- Ignoring third-party APIs: Mock dependencies to avoid rate limits.
- Overlooking network delays: Test in multi-region setups (e.g., AWS us-east vs. eu-central).
Wrapping Up
Organizations can confidently scale their applications by implementing structured throughput testing while maintaining excellent user experience. Start with clear metrics, implement appropriate testing tools, analyze results against business requirements, and apply targeted optimizations. This systematic approach to measuring and improving throughput will deliver maximum results for your applications and users.
