Simply put, you can easily reduce cycle time while increasing delivery velocity with the right tools and insights. This can be achieved without burning out your team or compromising code quality. It’s not about working harder; it’s about working smarter.
Cycle time vs. velocity: what’s the difference?
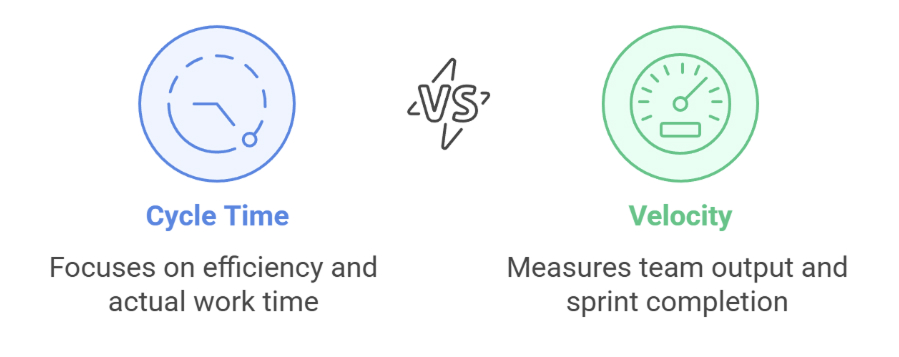
- Cycle time is the total duration a task takes from the moment it starts (“In Progress”) to when it’s marked as “Done.” It reflects actual time spent working on an item.
- Velocity, on the other hand, measures how much work your team completes in a given period, usually per sprint. It’s commonly tracked using story points.
“Velocity tells you how much you got done. Cycle time tells you how efficiently you did it.”
Both are useful, but when you’re trying to optimize delivery, cycle time metrics provide clearer information on what needs improvement.
Why does cycle time matter more?
Unlike velocity, which can be inflated or skewed by story point inflation or changing estimations, cycle time is based on real-time. That makes it a more objective and actionable metric.
Teams tracking cycle time agile workflows often uncover the following:
- Delays during QA or code review.
- Bottlenecks from excessive work-in-progress tasks.
- Task switching and unclear priorities.
Take a look at this visual breakdown:
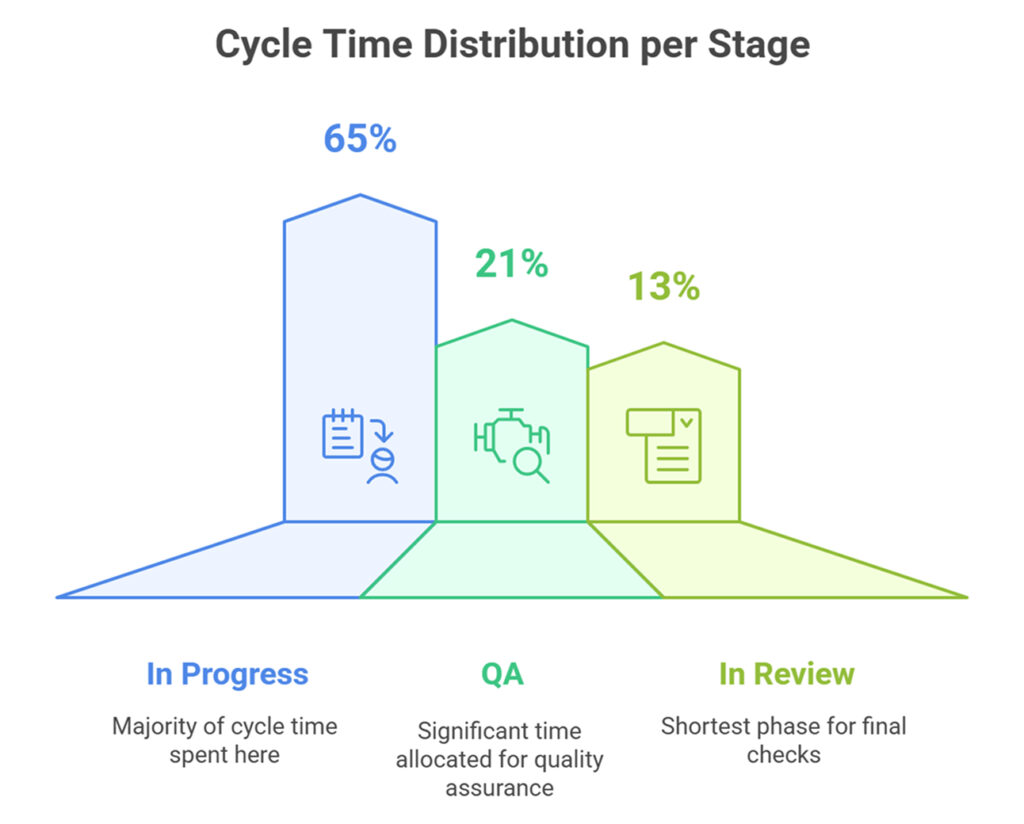
Here, over 65% of the time is spent “In Progress,” which usually indicates either unclear task scope or too many parallel items.
See the bottlenecks in your cycle time dashboard
Tools like Plandek, Axify, or Jira help teams visualize time spent in each stage using a cycle time dashboard:
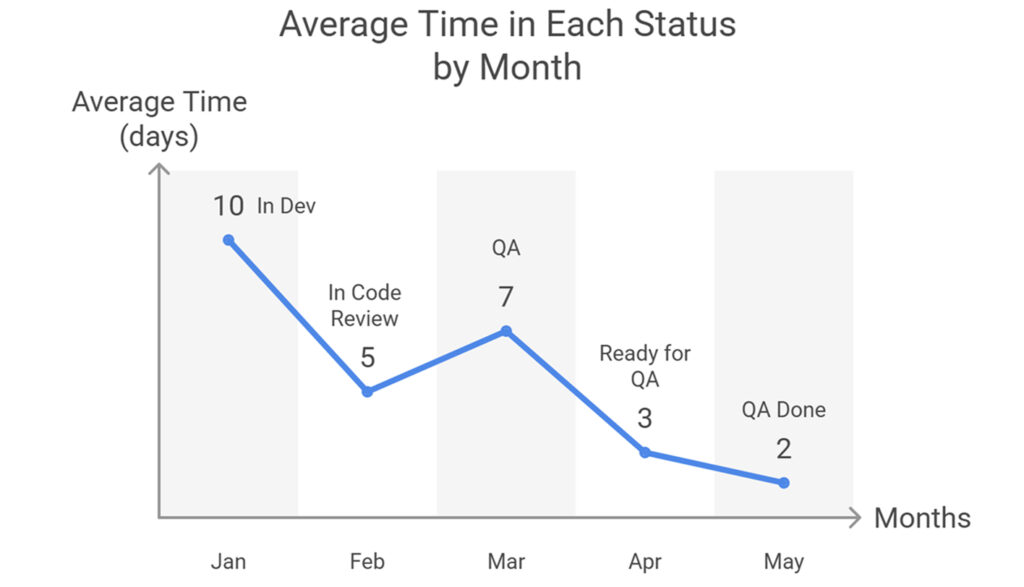
These visuals quickly show where teams are losing time, whether in dev, code review, QA, or acceptance. By acting on this insight, teams can shrink the timeline without working extra hours.
Faster cycle time = higher throughput
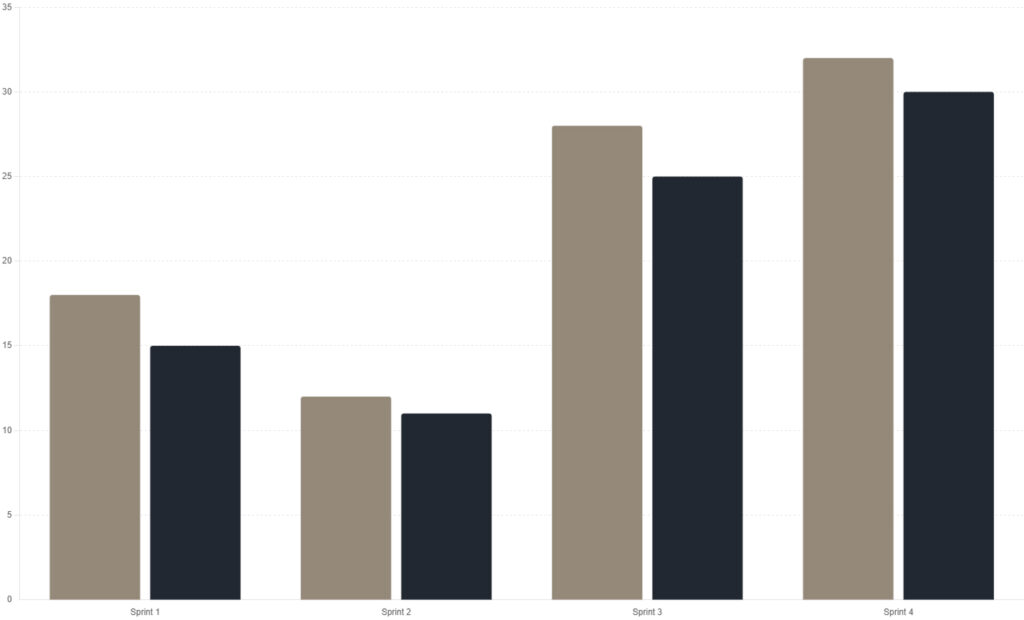
A shorter cycle time often leads to faster delivery and better velocity. Here’s why:
When each unit of work moves faster through the pipeline, the team completes more features in less time without necessarily increasing capacity. In the diagram below, the team hit nearly 100% in sprint, likely driven by better sprint planning and fewer bottlenecks.
How to actually reduce your cycle time
Limit work in progress (WIP):
- Focus on finishing, not just starting.
- Reduce context switching and cognitive overload.
- Use Kanban boards with explicit WIP limits.
Tighten feedback loops:
- Minimize delays in code reviews and QA.
- Set SLAs for review turnaround times.
- Involve QA and stakeholders earlier (shift-left approach).
- Use automation to notify reviewers and testers instantly.
Automate handoffs:
- Eliminate manual transitions between dev, test, and ops.
- Implement CI/CD pipelines to automate build, test, and deploy.
- Use tools to auto-transition tasks and update statuses.
- Automate regression and smoke tests to catch issues early.
Use real-time metrics:
- Track cycle time, WIP age, and bottlenecks per stage.
- Monitor ticket aging to prevent long stalls.
- Use tools like Axify, Jira Insights, or Linear for live visibility.
- Set alerts for anomalies in delivery patterns.
Standardize workflows:
- Define clear stages and criteria (e.g., Definition of Done).
- Use consistent branching and deployment strategies.
- Reduce variation to make the flow more predictable.
Reduce rework:
- Improve specs and acceptance criteria.
- Invest in automated and exploratory testing.
- Involve end-users in early feedback loops.
Encourage cross-functional collaboration:
- Break down silos between dev, QA, product, and design.
- Use shared tools and rituals (e.g., daily standups, joint planning).
- Co-locate related roles virtually or physically to speed up decisions.
Visualizing work in progress and throughput
- Monitor WIP trends: Helps predict delays and identify bottlenecks early.
- Track throughput: Measures your team’s actual delivery capacity over time.
- Focus on consistency: Even if velocity dips occasionally, a stable or improving cycle time indicates a healthier and more predictable delivery process.
Final thoughts
Can you reduce cycle time while increasing delivery velocity?
Yes, and you should.
The key is understanding that faster doesn’t mean rushed. It means removing friction in your process. With the right cycle time metrics, a smart cycle time dashboard, and a focus on lean delivery, teams can become both faster and more predictable.


