How to Use the SPACE Framework for Developer Productivity?
Written by

Status
answered
Written by
Status
answered

If you can’t measure it, you can’t improve it. But what if you are measuring the wrong things?
For years, engineering leaders have relied on metrics that actively harm their teams. With a staggering 83% of developers reporting burnout, it is clear that judging teams solely by the number of lines of code or tickets closed is not only inaccurate but also unsustainable.
This is where the
SPACE framework comes in, offering a better way to see the whole picture of developer productivity.
The SPACE productivity framework was introduced by researchers from Microsoft, GitHub, and the University of Victoria. Their goal was to create a multidimensional model that moves beyond simplistic activity counts.
They created the SPACE framework to capture the full story of developer work, publishing their findings in “The SPACE of Developer Productivity.” Instead of specific metrics, it provides five categories that together create a holistic view of developer work.
The SPACE framework helps you ask the right questions:
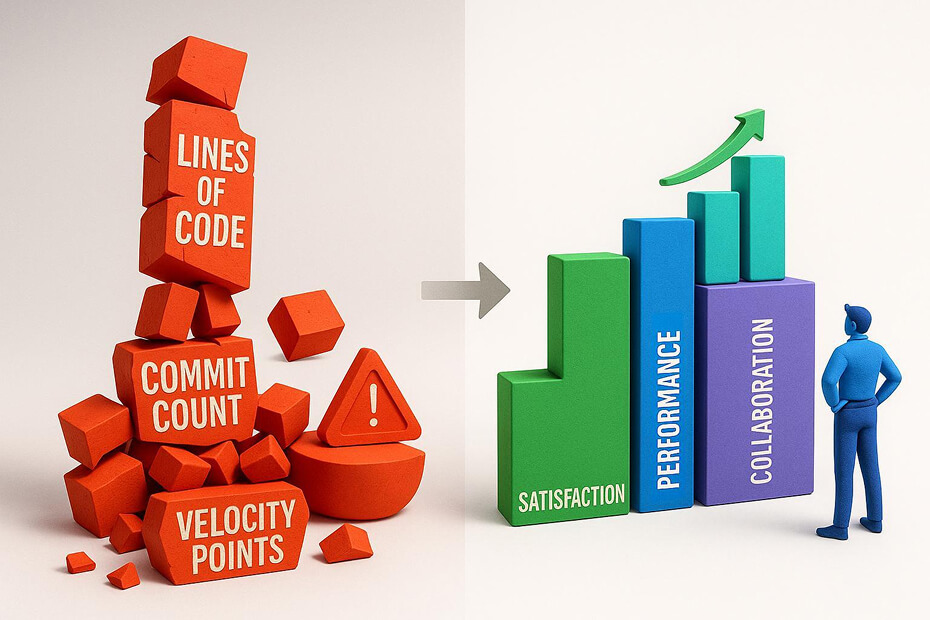
Common metrics for productivity, like lines of code, number of commits, or story points, can give a false sense of progress. For example, any development team could easily report positive statistics on productivity by generating a large amount of code that ultimately adds minimal value for users and perhaps introduces bugs as well. And it may not even add value for users.
Suppose a development focuses too heavily on these surface-level metrics. In that case, the team may chase arbitrary goals that could drive them not only to decrease productivity but also to decrease the quality of their work.
The SPACE framework helps address these gaps. Focusing on a broader set of signals brings attention to what actually drives developer productivity, as opposed to metrics that blindly measure certain characteristics, such as:
You can get started with this framework today without buying expensive software or hiring consultants. Just follow these steps.
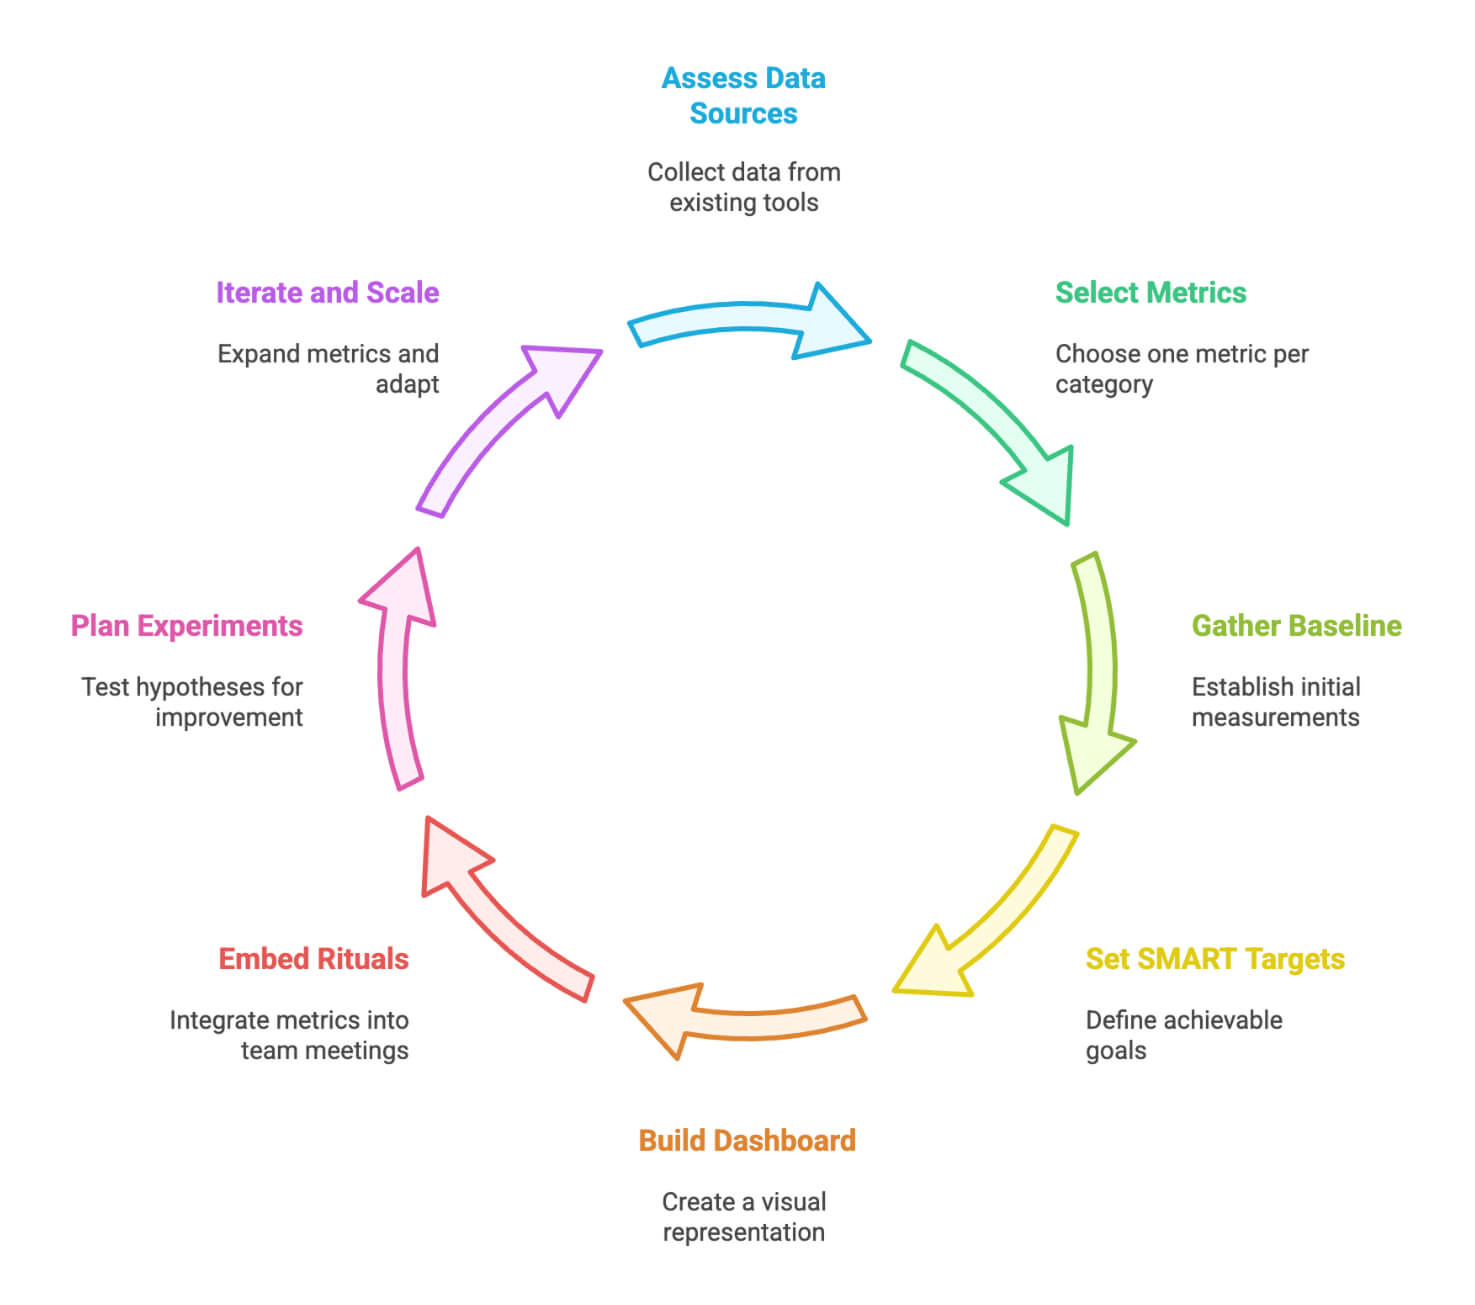
Begin by collecting data from the tools your team already uses. Most teams already generate useful metrics through tools like GitHub, Jira, documentation platforms, and survey tools. Organize these existing data sources under the five SPACE categories:
Satisfaction and well-being (S)
Use existing surveys or tools like Google Forms or Culture Amp. Track developer satisfaction through eNPS (Employee Net Promoter Score), team health check scores, and written responses. These inputs reflect how developers feel about their work, which can affect retention and performance.
Performance (P)
You can pull statistics from version control and CI/CD tools, such as GitHub Actions and Jenkins. Look for metrics such as lead time for changes, change failure rate, and deployment frequency. These indicate how your team is performing as they deliver software more reliably and efficiently whenever they make updates to production.
Activity (A)
Use data from GitHub and project management tools like Jira. Measure the number of commits, pull requests created, code reviews completed, and tasks closed. These show the volume of work being done, but should be interpreted alongside other dimensions like impact and quality.
Communication and collaboration (C)
Assess how easily information flows and how quickly people get unblocked. Use signals from docs, PR reviews, chats, handoffs between roles, and onboarding time to first PR. When these improve, teams wait less and ship faster without adding more hours.
Efficiency and flow (E)
Utilize project management dashboards and IDE add-ons to ease the flow of work. Look to metrics on cycle time, active versus inactive time spent by developers while coding, and work-in-progress (WIP) tasks. These will provide you with indicators of delays or the causes of bottlenecks.
Start with a single metric for each of the five SPACE categories. Avoid tracking too many data points at once. Selecting one well-defined metric per area keeps the process simple and makes it easier to establish a baseline. You can expand later if needed, but begin with these:
Satisfaction and well-being (S)
Use the Employee Net Promoter Score (eNPS), an indicator of how likely your team members would recommend their workplace to their friends. It is a quantifiable measure of overall sentiment and satisfaction.
Performance (P)
Use Lead Time for Changes, the duration of time from when a code change is committed to when it is released to production. It is a measure of how fast the team can produce working software.
Activity (A)
Use the number of pull requests reviewed. This measures the team’s collective activity in reviewing code for quality and understanding.
Communication and collaboration (C)
Use the team survey score for documentation. Ask your developers to assess how easy it is to find, understand, and use the documentation to begin to assess the clarity of shared knowledge.
Efficiency and flow (E)
Use Cycle Time, the measure of time it takes to complete a task, from the moment work begins to when the work is completed. Cycle time shows how fast work is processed.
Now, get your starting numbers, run your first survey, and pull one month of data from Git and Jira. You need to know what “normal” looks like before you can start improving it. A simple spreadsheet is all you need to log these first data points.
Work with your team to set SMART goals (specific, measurable, achievable, relevant, time-bound). A good goal sounds like: “Let’s try to lower our Lead Time from 3 days to 2 by the end of the quarter.”
You need to see your metrics. Create a basic dashboard with five charts, one for each of your chosen metrics. It can be in Google Sheets or a more advanced tool like Grafana. The key is to make progress visible to everyone on the team.
Metrics don’t matter if you don’t talk about them. Make it a habit.
Use the data to make decisions. If cycle time is high, form a hypothesis: “We think lowering our WIP limit will help.” Then, test it for two sprints. Assess the influence on both cycle time and team satisfaction. If it is successful for the team, maintain it; if not, start again.
After the team has an understanding of the first five metrics, you can introduce more metrics. The SPACE framework for developer productivity is not a rigid set of tools; it is about learning and adapting.
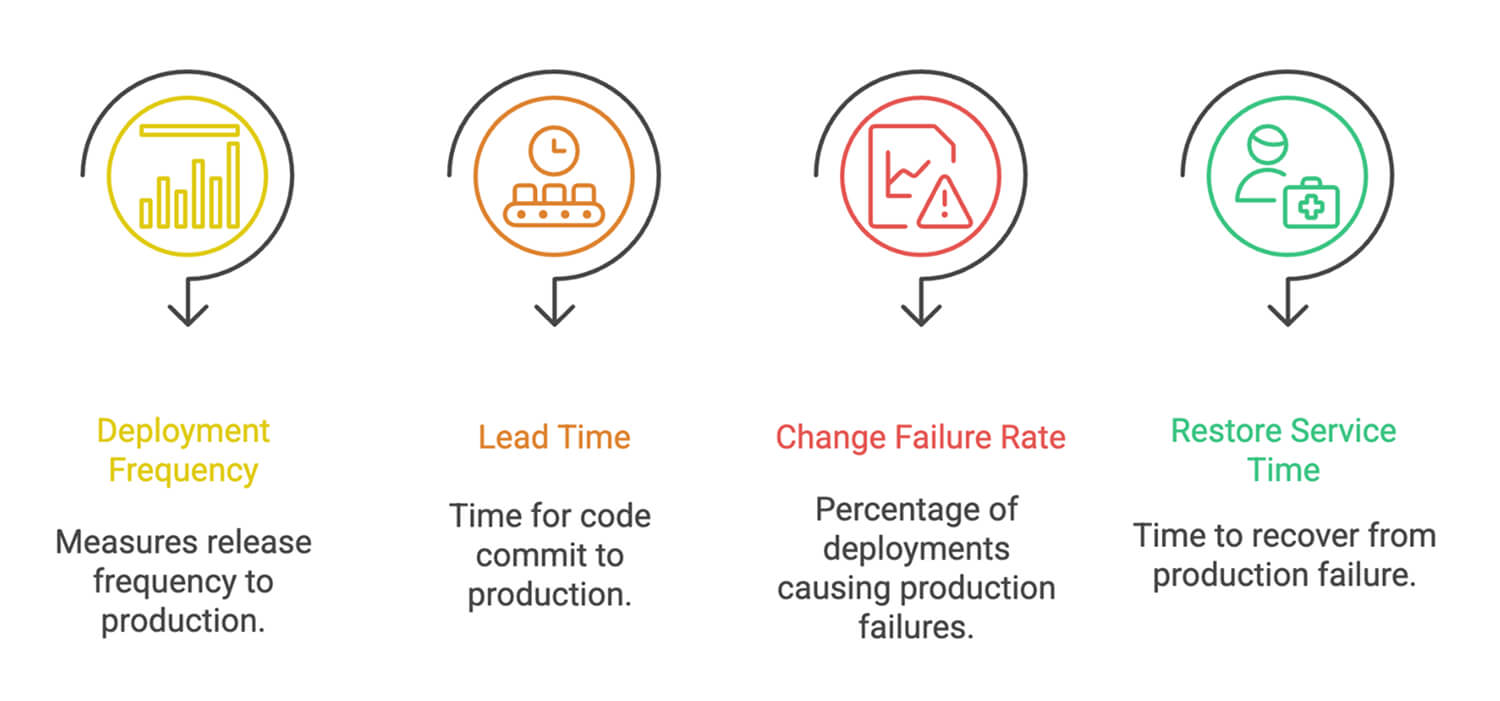
DORA (DevOps Research and Assessment), founded by Google’s DevOps Research and Assessment team, comprises four primary metrics for assessing DevOps performance:
The DORA and SPACE frameworks are complementary, not competing. DORA provides a focused, system-level view of software delivery throughput and stability. SPACE offers a broader, more holistic view that includes the human elements of development.
Consider the best day you’ve had as a developer recently. Chances are, you didn’t just write more code. You were engaged, solving problems, and went home feeling good about your day. That’s what developer productivity should really be about. It means creating real value for the team while helping them feel happy and fulfilled. Productivity isn’t about tracking everything your team does. It’s about creating an environment where people feel they can do their best work.

