How to measure the impact of Copilot on engineering productivity
8 min read• Feb 11, 2026
Written by

Milestone Team

Copilot adoption usually starts the same way as any other tool. A few engineers try it, then it rolls out to the entire team, and within weeks, you hear, “The development got faster than ever before.” That’s a reasonable first signal, but it’s not a measurement strategy.
The tricky part is that AI-assisted development can boost speed in one place while quietly adding drag elsewhere. Faster scaffolding might be offset by more review time. It’s not uncommon to see many file changes in a single PR these days when AI assistance is used. On the other hand, more code shipped may come with more rework. Or the opposite. Maybe you ship the same amount, but quality increases because engineers spend more time improving tests and observability.
This is why teams should measure Copilot’s impact as a system change, not a personal preference. You’re not just asking, “Do developers like it?” You’re asking what the AI impact on software development looks like in your environment across delivery flow, quality, and outcomes. GitHub has also started adding first-party visibility here, including a Copilot usage metrics dashboard and API for enterprises (currently in public preview).
If your definition of productivity is “more lines of code,” AI will fool you immediately. Copilot can generate syntactically valid code quickly, but raw output is a weak proxy for value.
A better definition is: How effectively a team turns intent into reliable change. That includes three layers:
This matters because Copilot can improve flow by removing friction (e.g., boilerplate and repetitive refactorings), but it can also increase the review and verification load if suggestions are accepted too quickly. Research shows meaningful speedups for certain tasks, but in real-world settings, progress may slow down if review and correction overhead dominate.
That’s why the goal isn’t to prove Copilot works in general, but to measure AI coding tool productivity in your environment as a system outcome, how work moves from intent to production, how stable it stays after release, and whether quality and operational load improve or degrade over time.
Copilot’s effects usually show up in a few predictable places:
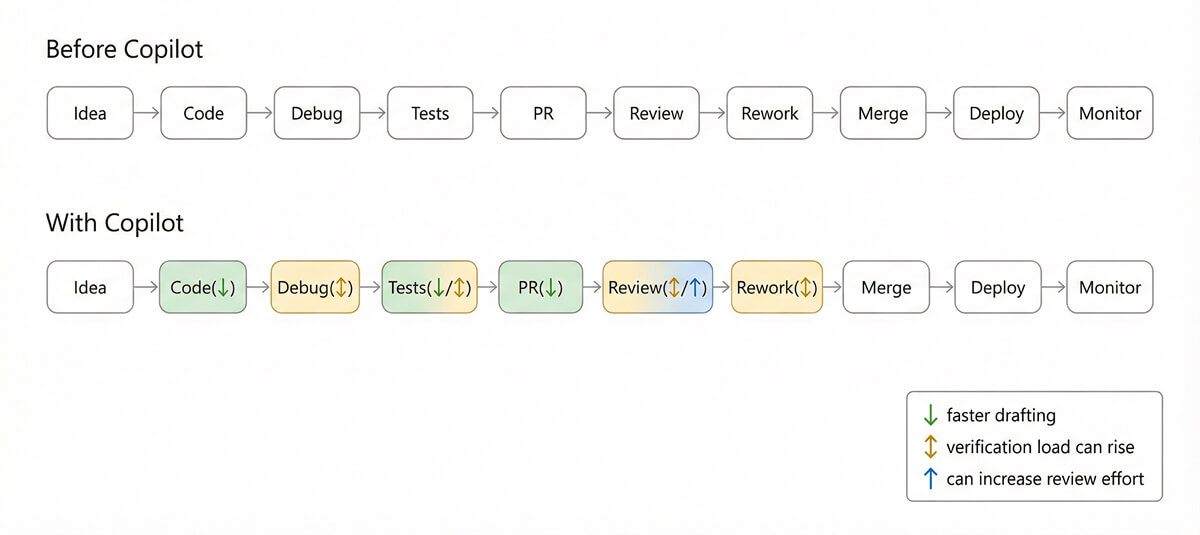
The point of measuring is to find which arrows changed for your teams, and whether the overall system improved.
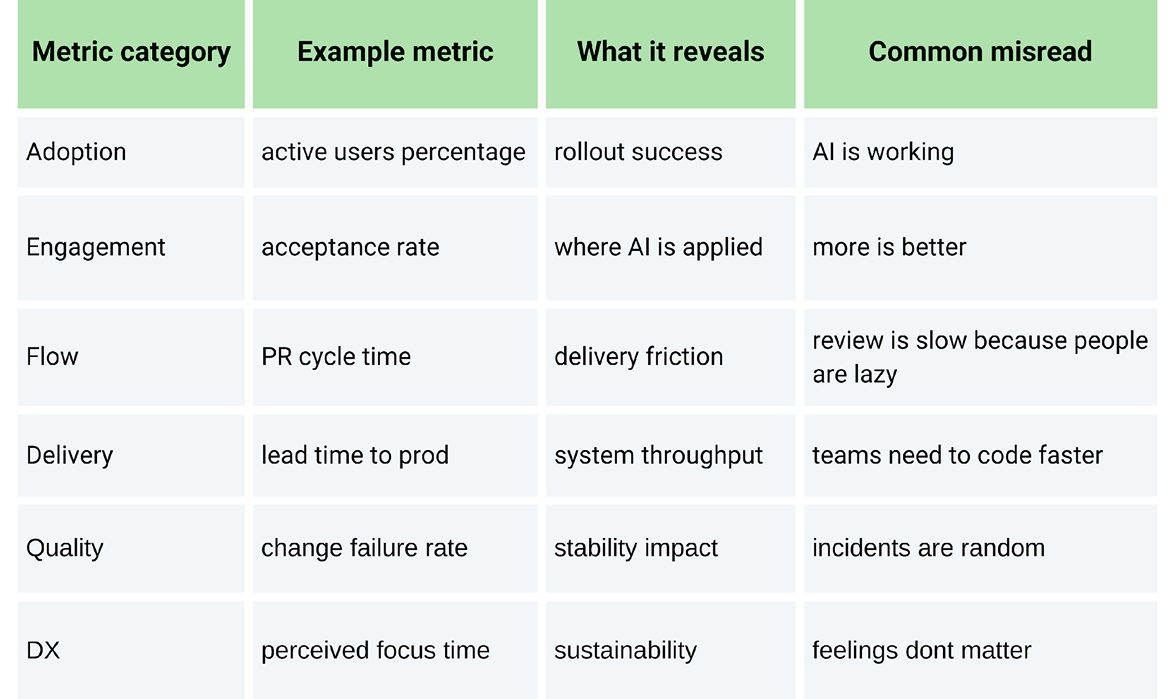
Think in four buckets: adoption, delivery, quality, and developer experience. The best programs track all four, because any one bucket can lie on its own.
These tell you whether Copilot is being used, where it’s used, and how consistently. GitHub’s Copilot metrics endpoints (and the enterprise dashboard) report usage trends, including active and engaged users and breakdowns by editors, languages, and features.
Helpful engagement signals:
Watch out: More acceptance is not automatically “better.” In some teams, higher acceptance can correlate with lower review discipline.
This is where your “system” metrics live-what executives care about and what engineers feel day to day. Use proven delivery performance metrics as anchors. DORA’s metrics are widely used because they correlate with broader organizational outcomes, and DORA has evolved its guidance over time (including a shift toward a five-metric model).
Core flow metrics to track:
Then add team-level flow detail:
This is where developer productivity metrics stop being vanity metrics and become decision-grade. They show whether Copilot improves throughput, reduces wait time, or simply shifts effort from coding to review.
Quality metrics should primarily answer the following two questions:
To measure these, you need to track metrics such as defects escaped to production (by severity), incident frequency tied to recent changes, post-merge reverts/hotfix rate, and test coverage movement (if meaningful in your context). It also includes security findings and dependency risks (especially if Copilot accelerates library adoption).
Developer experience matters because “felt productivity” affects morale and retention, but it needs to be structured and can be measured by a lightweight pulse check (monthly or quarterly) asking:
GitHub and others have published research linking Copilot to perceived productivity and developer happiness, but again, your environment is what matters.
A measurement framework should support a wide range of teams with different repositories, stacks, seasonal work, and shifting priorities.
Pick a baseline window that matches your delivery rhythm:
Capture baseline medians (not just averages) for flow and quality metrics. You want to compare distributions and not just a single number.
Avoid treating Copilot vs. no Copilot as a single big bucket for evaluation. You can segment by:
You’ll typically pull from:
Decide what must not get worse while chasing speed:
If a “productivity gain” violates guardrails, it’s not a gain.
# Example: GitHub REST API call (org-level Copilot metrics)
# Docs: GitHub "Copilot metrics" endpoints (preview availability varies by plan/policy).
# Requires an access token with appropriate permissions.

curl -L \
  -H "Accept: application/vnd.github+json" \
  -H "Authorization: Bearer $GITHUB_TOKEN" \
  -H "X-GitHub-Api-Version: 2022-11-28" \
  https://api.github.com/orgs/YOUR_ORG/copilot/metrics
The response can include breakdowns for IDE completions and chat usage, which you can aggregate into weekly trends and correlate with delivery and quality outcomes.
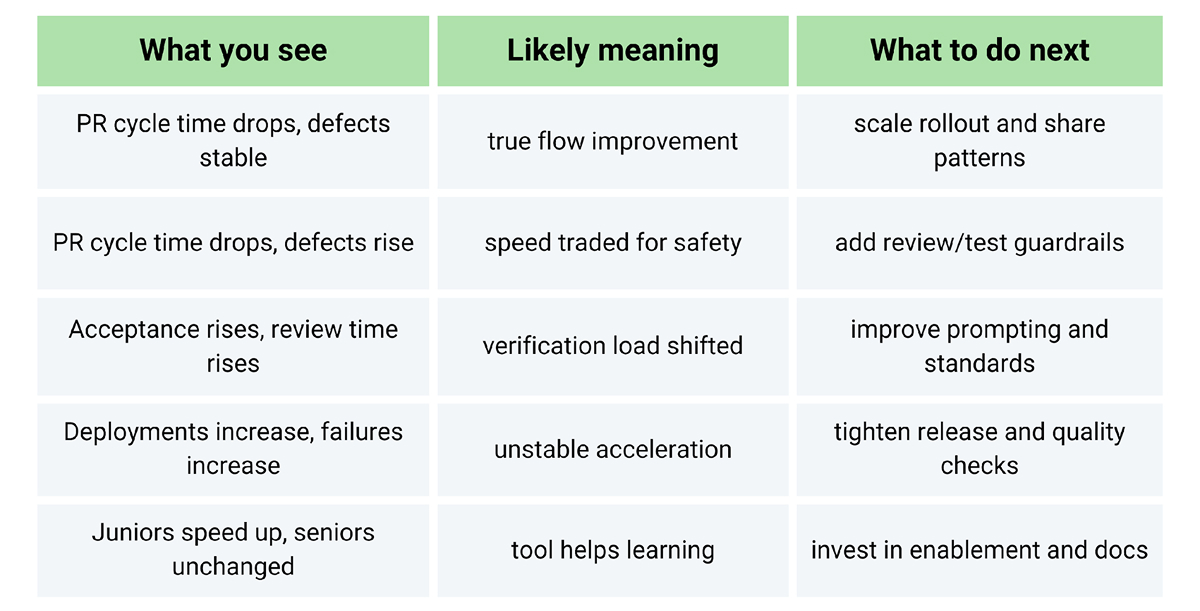
Once you have metrics in place, the next challenge is interpretation. There are some important practices you should follow.
Credible studies are showing large improvements in task speed in controlled settings (for example, a controlled experiment reported faster completion of a specific task with Copilot access).
But there are also real-world experiments showing the opposite for experienced developers on complex, familiar repositories where time shifts into prompting, waiting, reviewing, and correcting.
So instead of declaring “Copilot improves productivity,” evaluate it like this:
Copilot isn’t just “a faster keyboard.” It’s a workflow change that can improve drafting speed, reduce context switching, and help developers stay in motion, but only if the person behind it and the support system absorb the change responsibly.
If you measure only usage, you’ll mistake adoption for impact. If you measure only speed, you’ll miss quality debt. The teams that win treat Copilot like any other engineering investment: set baselines, track flow and stability, segment results, and enforce guardrails. Done well, you end up with a clear, defensible story about what changed and why, so you can scale what works and fix what doesn’t, instead of arguing about vibes.
Sure. While it may help with drafting and decrease time spent on a blank page, it may increase bugs or architectural inconsistencies if teams adopt suggestions without checking. The solution isn’t to restrict usage; it’s to put in place guardrails: tests, reviewing standards, and clear ownership of system design.
Use a balanced set of metrics, including Copilot adoption and engagement metrics, delivery flow metrics (lead time and PR cycle time), quality metrics (change failure rate and incidents), and developer experience (survey focus time). GitHub Copilot usage metrics dashboard/API gives usage metrics to capture adoption, but to provide evidence of impact, you will still need delivery and quality metrics.
Changes can be seen in engagement metrics within weeks, but for delivery and quality metrics, it usually takes 4 to 8 weeks, respectively. This is because you need time to complete a full delivery cycle and to move the work through coding, review, deployment, and operations.
Not always. Support scaffolding and learning; juniors and seniors place less value on context-heavy, deep work. There is sufficient variance in real-world outcomes, so segmentation by team and work type is necessary.
Lead with business-relevant outcomes, backed by delivery and quality metrics:
Sign up to our newsletter
By subscribing, you accept our Privacy Policy.