Platform engineering is often sold as a promise of faster delivery, fewer broken pipelines, happier developers, and less time spent on repetitive work. But once the platform is in place, you may feel overwhelmed by the need to integrate CI/CD data, optimize flows, build internal developer portals, and implement shared infrastructure modules. Sometimes you may wonder whether the effort is worth it to invest in the platform.
That’s where platform engineering metrics come in. If you measure the right signals, you can see whether your platform is accelerating teams or quietly becoming a source of friction. If you measure the wrong ones, you’ll end up with dashboards full of numbers that look impressive but don’t help decisions.
This article breaks down 12 practical metrics that platform teams can track to understand developer experience, efficiency, reliability, and business impact.
Why Platform Engineering Metrics Matter
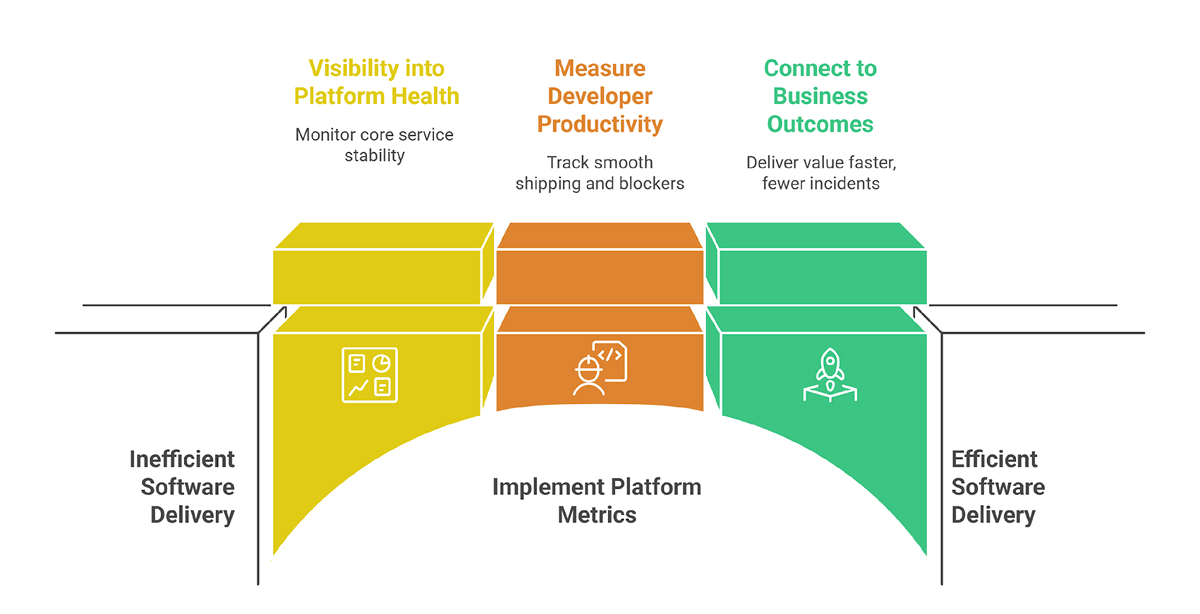
A platform team’s job is not only to build capabilities. It’s to make software delivery easier, safer, and faster for product teams. The right measurement helps you:
- Get visibility into platform health: Are core services, such as CI/CD pipelines, artifact storage, and the developer portal, stable and responsive?
- Measure developer productivity and experience: Are developers shipping more smoothly with fewer blockers?
- Connect platform work to business outcomes: Are teams delivering value faster with fewer incidents and less waste?
Also, metrics create shared language. Instead of debating opinions like “the portal feels slow,” you can discuss and base your decisions on facts like “average latency has increased 30% since the last release.”
Developer Experience and Productivity Metrics
These are the metrics your developers feel every day. If they’re bad, teams won’t be able to get the maximum out of the platform.
1. Lead Time for Changes
Definition: The time period between when a code change is merged (or committed) and when that change is live in production.
This is one of the oldest DORA metrics, yet it remains an important indicator of flow in the delivery process. The shorter the lead time, the less likely you are to experience bottlenecks in the delivery process, slower reviews, complex processes, environments, or pipelines.
How to measure:
- Track timestamps for key stages in the development cycle, including time to merge a PR, CI build times, and full deployment time.
- Report percentiles (p50/p90), not just averages, since averages hide some important information.
Why it matters for platform teams:
- Lead time tells you whether your “golden path” is reaching any major pain points.
- You can identify problematic areas in the delivery process, such as build, test, security scans, approvals, and manual steps.
Common pitfalls:
- Measuring only “happy path” services.
- Ignoring long-tail delays caused by approvals, flaky tests, or environment issues.
2. Deployment Frequency
Definition: How often teams deploy to production (or a user-facing environment).
Frequent deployments are not the goal by themselves. But they often indicate whether pipelines are stable, releases are low-risk, and teams trust the platform.
How to measure:
- Deploys per service per day/week.
- Split by environment if needed (staging vs. production).
Why it matters:
- If frequency drops, something is slowing teams down.
- If frequency spikes while failure rates spike too, you may be shipping chaos faster.
Tip: Pair this with the change failure rate (Metric #7) to balance speed and safety.
3. Developer Onboarding Time
Definition: Time for a new developer (or a new team) to go from “access granted” to “first meaningful change shipped.”
This is one of the most honest signals of platform usability. If onboarding takes weeks, your platform may be powerful but not usable. Track milestones like access to repos, CI, clusters, and environments, local dev setup time, first successful pipeline run, and first production deploy.
Why it matters:
Onboarding time reflects documentation quality, automation maturity, and day-one experience. It reduces dependency on tribal knowledge.
Efficiency and Cost Optimization Metrics
A platform that scales delivery but burns money is not successful. These metrics help you run the platform like both a product and an engineering system.
4. Resource Utilization
Definition: How efficiently you’re using compute, storage, and other cloud resources.
Examples:
- CPU/memory usage vs. requested limits (Kubernetes).
- Idle instances, underutilized clusters.
- Storage growth rate, orphaned volumes.
Why it matters:
- Underutilization often leads to overprovisioning and wasted spend.
- Overutilization increases latency, failures, and noisy-neighbor issues.
Practical approach:
- Report utilization by cluster/team/service.
- Track waste as a trend, not a one-time audit.
5. Cost per Team or Service
Definition: Cost of the platform broken down per team, service, or product
This means the metric flips the cost conversation from blame to choice. It allows teams to see how architecture and usage drive cost.
How to implement:
- Use cost allocation tags/labels.
- Break down shared platform costs (CI, observability, shared clusters) fairly.
Why it matters:
- Promotes transparency and better decisions.
- Helps justify platform investments with concrete savings or avoided costs.
This is where many teams build an engineering KPI dashboard that combines delivery metrics and cost signals, which is useful as long as it stays actionable.
6. Automation Coverage
Definition: Percentage of operational and delivery tasks that are automated vs. manual.
Automation coverage directly reduces toil. It also reduces variability (humans don’t run playbooks the same way every time).
What to count:
- Is environment provisioning automated?
- CI/CD templates and self-service deploys?
- Are rollbacks automated?
- Are access requests self-service?
- Are incident workflows automated?
A simple way to compute it:
- List key workflows and mark them as automated, partially automated, or manual.
- Score them and track improvement quarter over quarter.
Example Prometheus-style metric (illustrative)
# Count of deployments executed via standard pipeline (automated)
platform_deployments_total{mode="pipeline"} 12450

# Count of deployments executed manually (break-glass)
platform_deployments_total{mode="manual"} 37
Reliability and Platform Health Metrics
Platform engineering often increases speed. But speed without stability just creates more problems in the long run.
7. Change Failure Rate
Definition: Percentage of deployments that result in failure requiring remediation (rollback, hotfix, incident, or degraded service).
A “failure” should be defined clearly. Don’t dilute it. If your definition is too broad, it becomes noisy. Too narrow, and it becomes meaningless.
Why it matters:
- It exposes quality and safety issues in the delivery path.
- It tells you whether guardrails (testing, scanning, policy) are effective.
Actionable follow-ups:
- Identify the top failure causes (i.e., config drift, secrets, flaky tests?).
- Improve templates, validations, and pre-deploy checks.
8. Mean Time to Recover (MTTR)
Definition: Average time to restore service after an incident.
MTTR is heavily influenced by platform capabilities, including observability quality (logs, metrics, traces), alert signal-to-noise ratio, runbook quality, rollback speed, and incident tooling.
How to make it useful:
- Track MTTR by incident severity.
- Track p90 recovery time (long incidents are what hurt trust).
Why it matters:
- Faster recovery improves customer impact.
- It also improves developer confidence in releasing frequently.
9. Platform Availability (Uptime)
Definition: Availability of platform services used by developers.
This includes CI/CD runners and build systems, artifact registries, an internal developer portal, secrets management, and environment provisioning services.
Why it matters:
- Platform downtime impacts every team at once.
- Even short outages can destroy developer trust.
Practical guidance:
- Measure availability from the developer’s perspective (synthetic checks).
- Publish status pages internally.
Business Impact and Value Delivery Metrics
These metrics show whether the platform is used and whether it improves outcomes beyond engineering.
10. Feature Adoption Rate
Definition: How widely platform features are used.
If teams aren’t adopting the “golden path,” your platform is not the default route; it’s more like optional documentation.
How to measure:
- Percent of services using standard CI templates.
- Percent using paved road deployment.
- Percent onboarded to the internal developer portal.
- Percent instrumented with standard observability.
Interpretation matters:
- Low adoption may mean the feature is hard to use, not that teams are stubborn.
- Track adoption alongside feedback and time-to-onboard.
This is a key part of understanding real-world platform metrics since usage is often the clearest proof of value.
11. Developer Satisfaction (Internal NPS)
Definition: A lightweight sentiment measure, often asked as:
- How likely are you to recommend the platform to a teammate? (0-10)
- What’s the biggest friction point right now? (free text)
Satisfaction is not soft; it predicts whether developers will use the platform, contribute improvements, and stop building side paths.
How to run it well:
- Keep it short (2-4 questions).
- Run it regularly (monthly or quarterly).
- Share results and what you’re doing about them.
Pro tip: Tag responses by team and workflow (CI, environments, portal). Patterns will show up fast.
12. Cycle Time from Idea to Delivery
Definition: How long it takes to go from an idea (ticket created, spec approved) to a production feature.
Unlike lead time (commit to production), cycle time captures planning delays, environment waiting time, dependency constraints, testing, and release coordination.
Why it matters:
- It connects platform capability to business agility.
- It’s a strong proxy for overall engineering performance across the delivery system.
How platform teams influence it:
- Faster environment provisioning.
- Reusable templates.
- Paved roads that reduce coordination overhead.
- Fewer manual gates through automated checks.
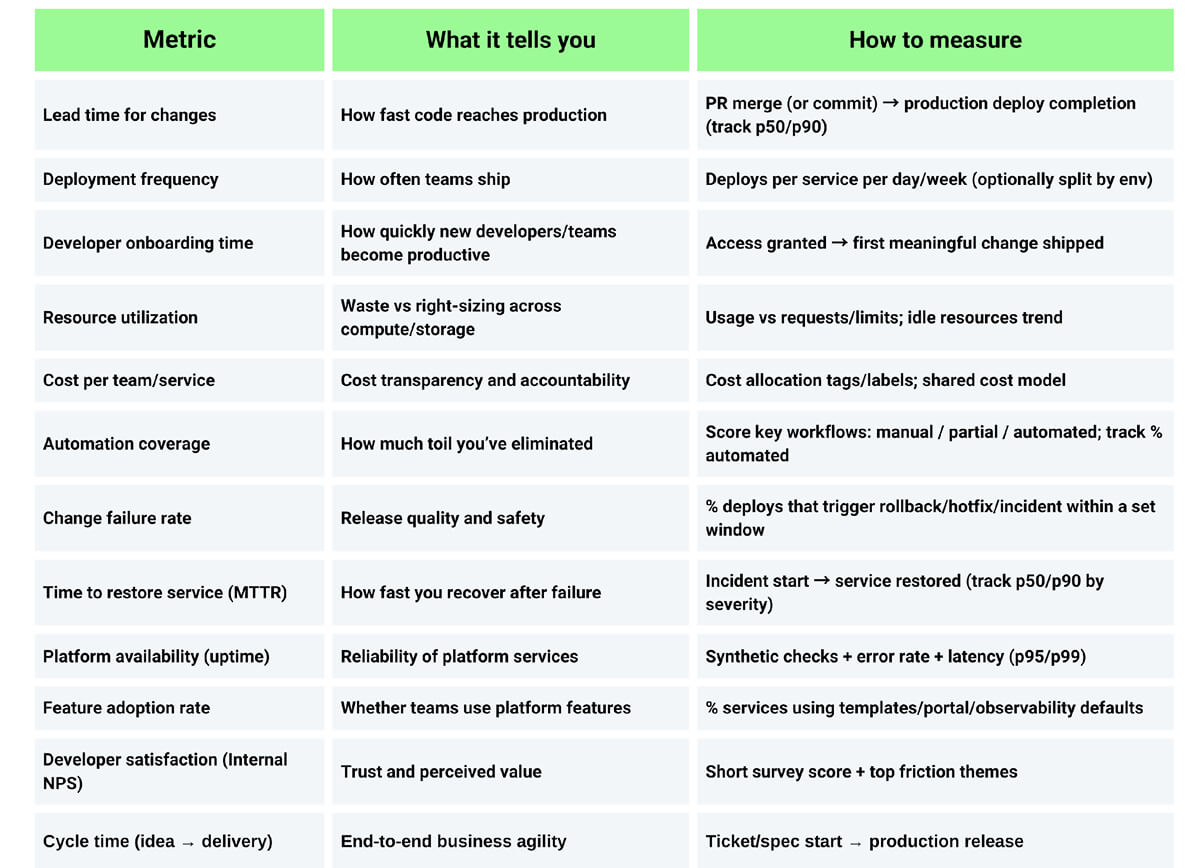
Quick Summary: What to Track and How to Measure It
How to Avoid Vanity Metrics
Vanity metrics create comfort, not clarity. For example, the number of portal page views doesn’t add value without linking to outcomes, or the number of pipelines created without adoption or success rates doesn’t add any value. Instead, ask:
- What decision will this metric influence?
- What behavior does it encourage?
- Can teams act on it within a sprint or two?
A healthy measurement system leads to targeted improvements, not just reporting.
Conclusion
If you track everything, you’ll learn nothing. But if you track the right 12 metrics, you’ll get a clear view of platform value:
DevEx and flow: lead time, deployment frequency, and onboarding time.
Efficiency: utilization, cost allocation, and automation coverage.
Reliability: change failure rate, MTTR, and uptime.
Business value: adoption, satisfaction, and idea-to-delivery cycle time.
The goal isn’t a perfect dashboard. The goal is a platform that improves outcomes and a measurement system that tells the truth about where you are today and what to fix next.
FAQ
1. How do platform engineering metrics differ from traditional DevOps metrics?
DevOps metrics often focus on delivery and operations outcomes for a product or team. Platform metrics focus on how the platform enables many teams at once, including adoption, self-service success, and platform reliability. There’s overlap (DORA metrics), but platform teams also need product-style metrics, such as adoption and satisfaction.
2. Which platform metrics matter most for executive reporting?
Executives usually care about outcomes and risk:
- Cycle time from idea to delivery
- Change failure rate
- MTTR
- Cost per team/service (trend)
- Adoption rate of platform capabilities
Keep it tight. Show trends and business impact, not raw telemetry.
3. How can platform teams avoid vanity metrics when measuring success?
Tie each metric to a decision. If a metric can’t trigger an action (improve pipelines, remove toil, fix reliability), it’s probably vanity. Also, pair metrics (speed and stability) so the story stays honest.
4. Can platform engineering metrics improve cross-team alignment?
Yes. Shared definitions (What counts as a failure? What is “onboarded”?) reduce arguments. A small, consistent set of metrics helps product, security, and platform teams align on trade-offs and priorities.
5. How often should platform metrics be reviewed and adjusted?
Review core metrics weekly or biweekly. Re-evaluate the full set quarterly. Platforms evolve, your measurement should evolve too. Retire metrics that don’t change decisions.