8 Top Software Analytics Platforms in 2026
9 min read• Feb 25, 2026
Written by

Milestone Team

Engineering teams generate mountains of data. These data come from many sources, including pull requests, CI runs, Jira tickets, incidents, code reviews, release tags, on-call pages, and more. Therefore, the problem isn’t simply a lack of data; it’s the inability to identify these sources, find tools, and develop mechanisms to analyze them for valuable insights.
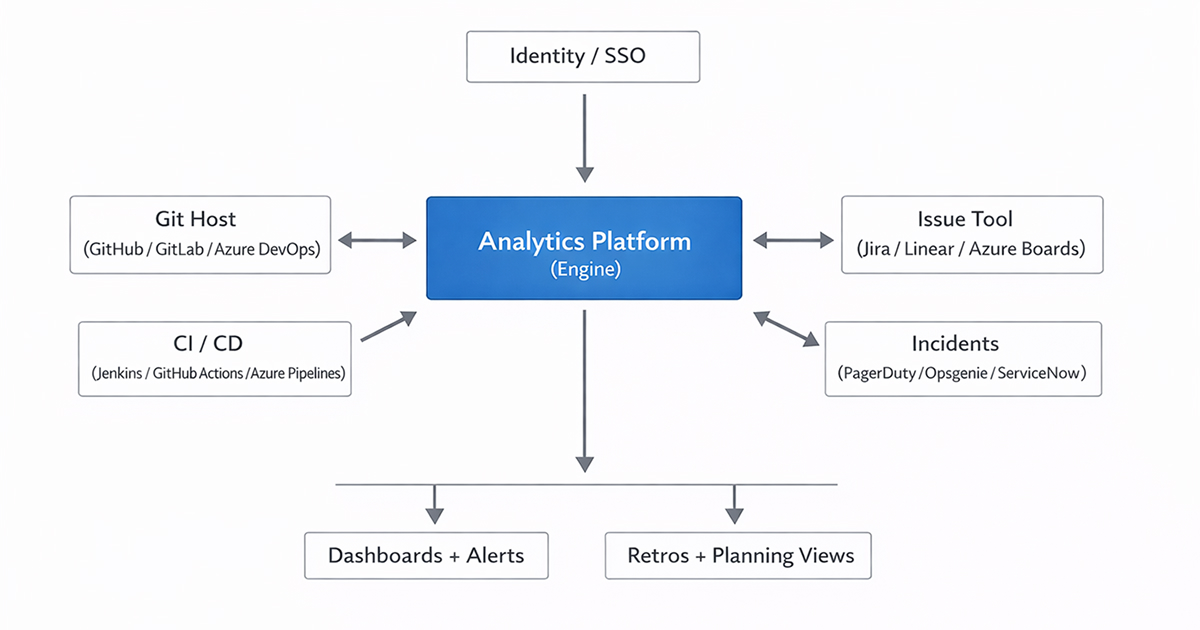
In software development, have you ever wondered why some changes take days while others take weeks? Where does work get stuck-in review, testing, approvals, or waiting on another team? Are we actually getting faster, or just moving the bottleneck around? That’s the gap software analytics platforms try to close. They connect to the tools you already use, pull activity signals from across the SDLC, and turn them into actionable workflow visibility, cycle time, review delays, rework patterns, release health, and capacity constraints. Done well, this becomes less about dashboards and more about engineering clarity. They address what to fix, what to protect, and even what to stop tracking.
One of the most important factors in choosing a platform is finding one that aligns with the tools your engineering team uses. And you only need the metrics that map to the outcomes you care about and that have enough context to act on. Another important aspect you need to consider is its usability for engineers. If only leadership opens the dashboard, the platform can become a reporting layer rather than an improvement loop.
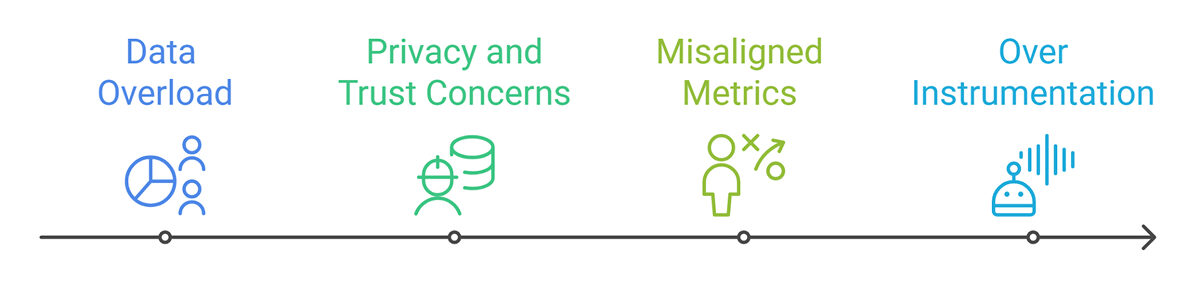
The best tools make it easy to bring data into retrospectives, planning, and incident reviews without making engineers feel they are being scored. There are several challenges and limitations you need to overcome.
Now, let’s look into the focus of the topic. Below are eight strong options that are popular among engineering teams seeking workflow visibility, delivery predictability, and access to healthier metrics.
We start with Milestone because it brings delivery performance metrics, engineering investment visibility, and GenAI adoption and impact tracking into a consolidated view, helping teams correlate speed, effort, and AI usage more easily.
Milestone is an engineering intelligence platform that turns day-to-day developer activity into actionable insights, focused on engineering performance, engineering investment, and GenAI usage/impact.
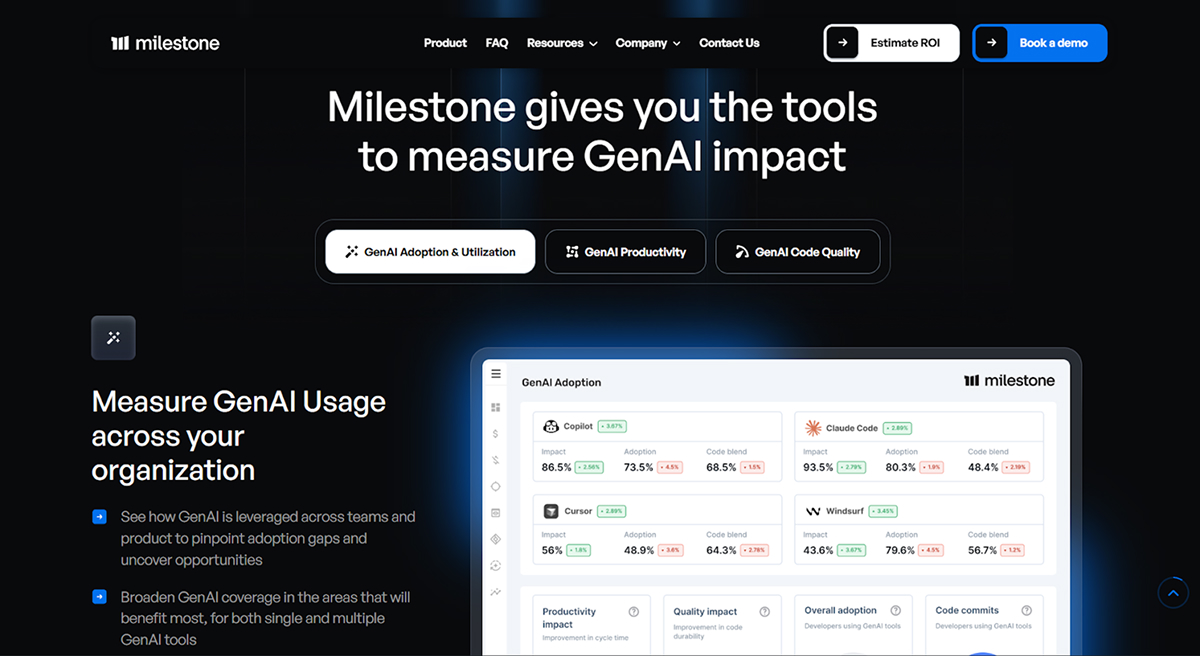
Its main features include:
Milestone is the best fit for engineering leaders and managers who need a clear, reliable view of delivery and GenAI impact across teams, connecting to tools like GitHub and Jira to ingest and analyze engineering activity.
LinearB is an AI productivity platform that aims to make engineering more efficient and improve delivery outcomes. Its main features include:
This platform’s best fit is when you want actionable workflow insights, guardrails, and consistent engineering metrics across teams. Its main differentiator is to have explicit focus on AI-era productivity and governance, not just legacy SDLC reporting.
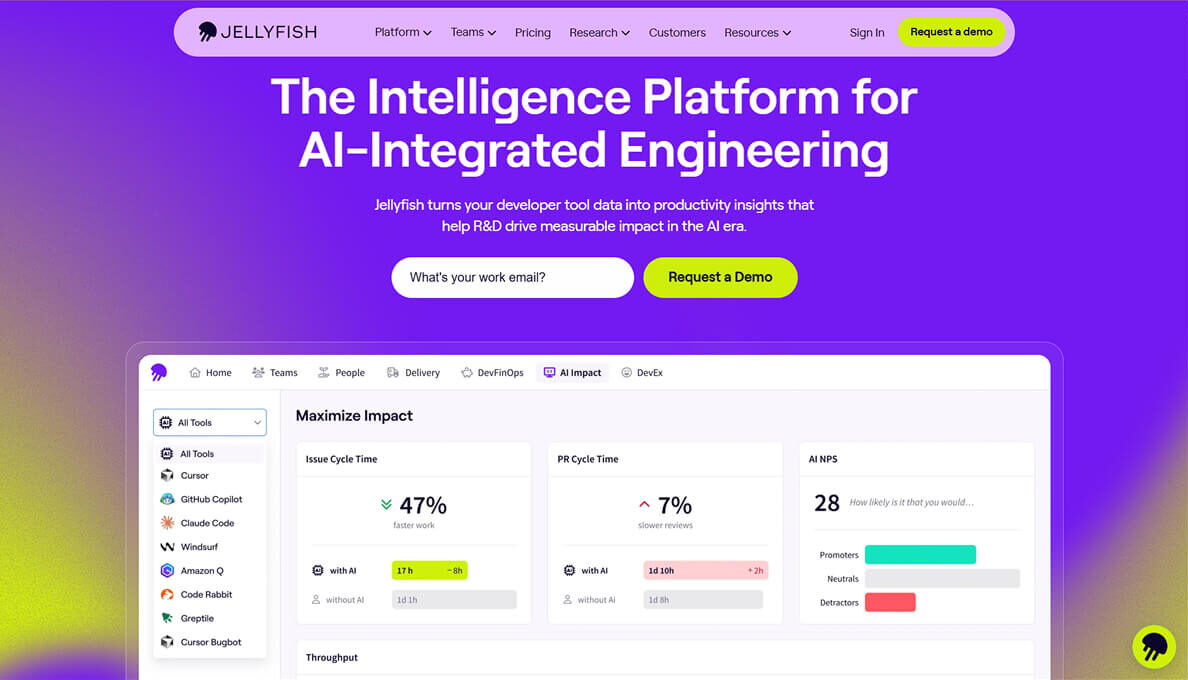
Jellyfish is a software engineering intelligence platform that emphasizes aligning engineering performance and delivery with business strategy. The platform integrates with systems such as Jira and GitHub to process engineering data and provide leaders and cross-functional stakeholders with metrics and visibility. Its main features include:
This platform is one of the few choices when you need to translate engineering work into business-facing narratives (i.e., allocation, planning, impact). It differentiates itself from others by focusing on providing additional value for leadership, combining engineering decisions and insight with financial and business impact.
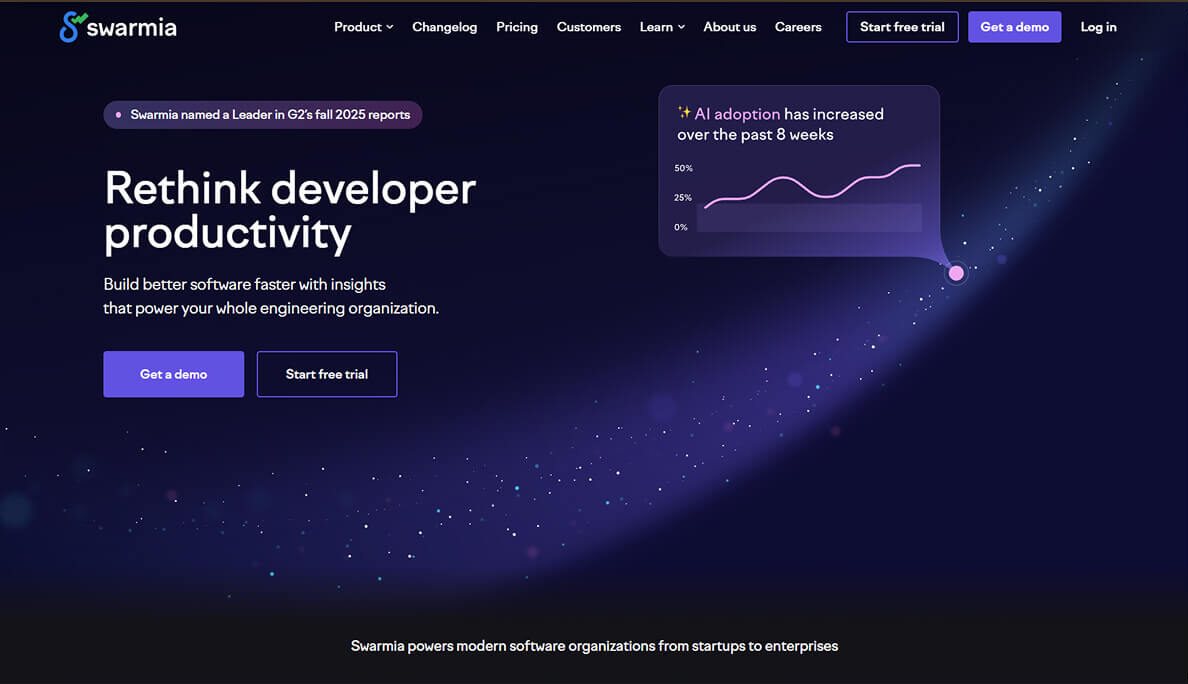
Swarmia works well when you want engineering analytics that don’t stop at delivery speed. It’s one of the few platforms that consistently ties together business outcomes, developer productivity, and developer experience, which is usually where real improvement work happens (not in a single “velocity” graph). Its main features include:
This platform is best for teams that want to improve delivery and reduce friction, and who prefer a system that supports retrospectives and habit-building, not just reporting. It differentiates by placing strong emphasis on combining metrics, feedback (DX surveys), and workflow nudges, making it easier to connect numbers to real causes.
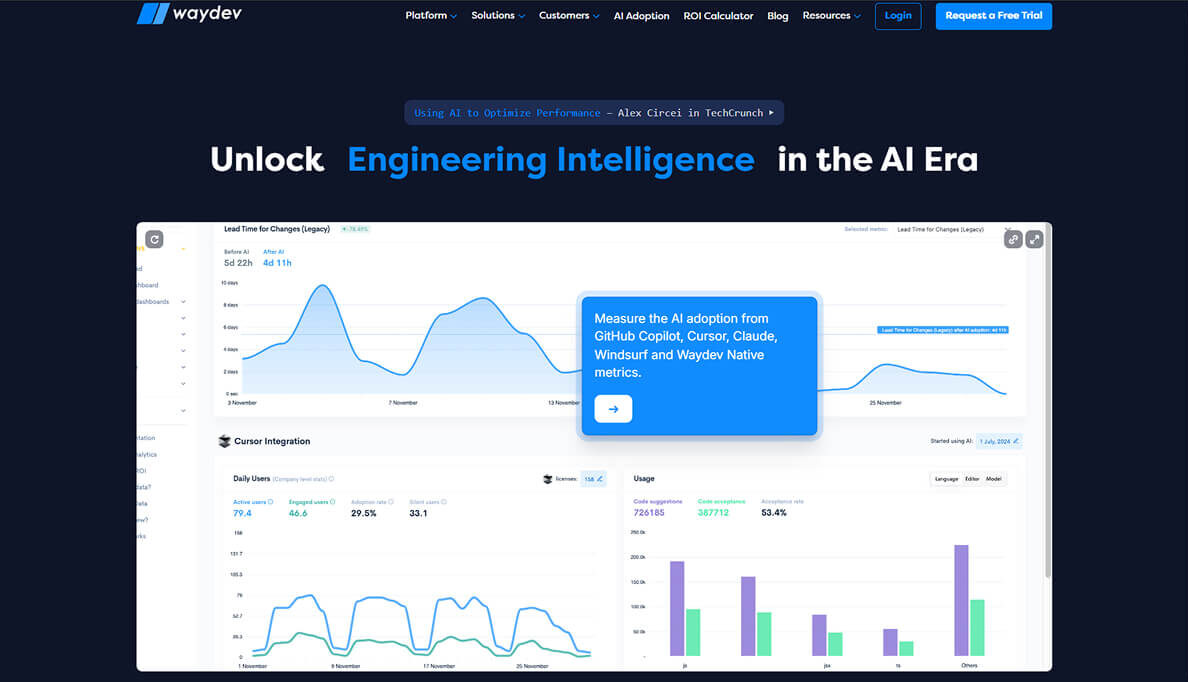
Waydev is a solid choice when you want classic delivery metrics (DORA, cycle time, PR insights) but also need practical add-ons for planning and reporting, especially at the leadership level. What stands out is the breadth: it’s not just “DORA dashboards.” It adds hygiene checks, benchmarking, planning views, and customization options that become important as you scale. Its main features include:
This platform is best suited for those who want classic delivery metrics like DORA, cycle time, and PR insights, as well as leadership-ready views such as sprint commitment, velocity, and resource allocation. It differentiates by combining delivery analytics with planning and reporting depth (including customization and finance style reporting, such as capitalization), making it practical for organizations scaling their metrics program.
Typo is built for teams that want real-time SDLC visibility, with a modern focus on bottlenecks, DevEx, and the impact of AI coding tools. It’s structured around the day-to-day reality of engineering work, answering the questions of what’s blocked, what’s delayed, and what’s creating drag. Its main features include:
This platform is best suited when you want clearer SDLC visibility, such as bottleneck detection, DORA tracking, and blocker signals, and you also want to understand how AI coding tools affect delivery and risk. It differentiates by combining AI impact tracking and AI-assisted code review with workflow analytics.
Code Climate is an option when the real question is bigger than “Are PRs moving fast?” It’s more useful when leadership needs a reliable picture of capacity, predictability, and where engineering effort is going, especially across multiple teams. Its main features include:
This platform fits well when you need clarity on capacity, delivery predictability, and engineering impact, especially for high-level planning. It differentiates by emphasizing a leadership view that connects capacity and execution to goals and outcomes, making it easier to manage tradeoffs across teams rather than optimizing a single repo or metric.
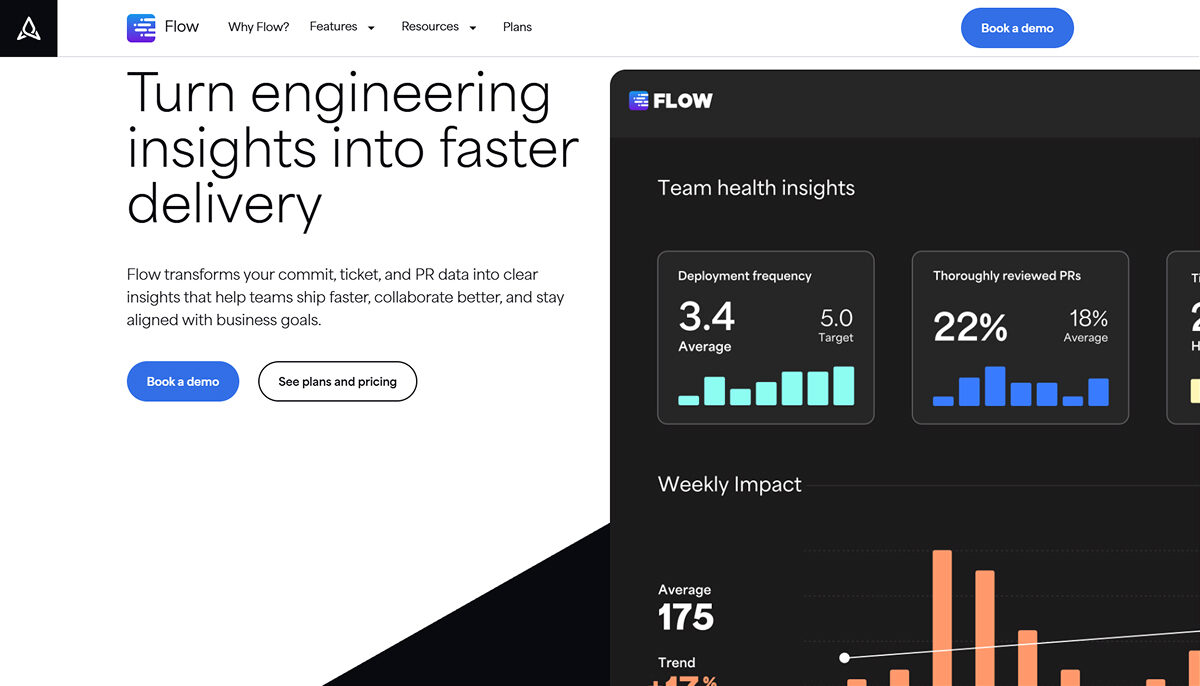
Flow is a mature workflow analytics platform that works well in enterprise environments, especially where Jira and Azure DevOps are common. It’s built for consistent reporting across teams, with structured views that are easy to reuse in weekly or monthly operating rhythms. Its main features include:
This platform is the best fit when you want a proven workflow analytics product that integrates cleanly with enterprise stacks like GitHub, Jira, and Azure DevOps, and supports DORA-style delivery reporting. It differentiates from mature, structured reporting (like team health and retrospective views) that teams can reuse in operating rhythms, not just read once as a dashboard.
In 2026, the teams that win aren’t the ones with the most dashboards. They’re the ones who can see reality clearly and change it efficiently.
Software analytics platforms help you do that by turning scattered SDLC signals into a shared picture of flow, friction, and risk. But picking a platform is only half the battle. The other half is putting it into practice: reliable metrics, clear definitions, and a culture that uses data to improve systems rather than judge people.
Choose a tool that aligns with your company’s maturity level and goals. Start with a small group and prove it works. Then, as with any other engineering system, keep improving your metrics by reviewing and refining them over time.
If you want the best overall platform that combines engineering performance, investment visibility, and GenAI impact tracking in one place, while keeping insights usable for both leaders and teams, Milestone is the strongest starting point in 2026.
They are evolving from static dashboards to decision-support systems: a fusion of workflow data with developer experience data and, increasingly, the measurement of AI’s effects on delivery and risk. Additionally, many continue to unify business outcome, productivity, and experience views.
Start with integration depth (can it pull reliable signals from your actual toolchain?), clarity of metric definitions, and whether the platform supports team-level improvement without encouraging surveillance. Flow, for example, highlights broad SDLC integrations across common tools.
Yes, when the platform translates engineering work into outcomes: delivery predictability, investment allocation, risk trends, and planning tradeoffs. Tools like Jellyfish and Code Climate Velocity explicitly position themselves around business alignment and leadership visibility.
Most connect to Git hosts and issue trackers first, then expand into CI/CD and incident systems. Flow describes pulling data across the SDLC and visualizing it in reports; many platforms offer similar ingestion and normalization pipelines.
When data is over-instrumented, false correlations can be introduced, trust can be broken (especially if these metrics judge people), and noise can increase. The safest approach is to instrument selectively, focus on trends, and avoid performance metrics. Instead, use metrics to evaluate improvement experiments.
Sign up to our newsletter
By subscribing, you accept our Privacy Policy.