In this digital age, performance is what makes or breaks an application. A poorly performing application can be damaging as even the smallest change in loading time can greatly affect a business. Thus, response time is a vital component when considering an application.
What is Application Response Time?
Application response time indicates the duration between a user action and the application server response. For instance, when you submit a form or click a link, there is a period of time until the application responds to that action. This time gap is referred to as application response time, which can vary from milliseconds to minutes, depending on the application’s performance.
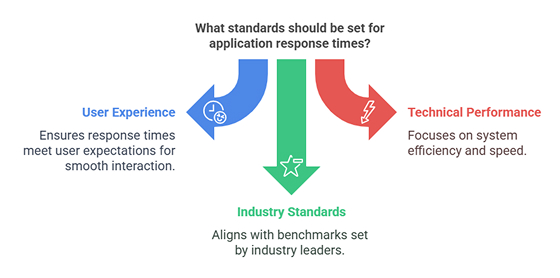
Application Response Time Standards
Different systems have different response time requirements, depending on how they are used.

Jakob Nielsen’s Response Time Limits
Jakob Nielsen, a well-known usability expert, has outlined three key response time categories based on user expectations:
0.1 seconds (100 milliseconds) – Feels Instant
Users don’t notice any delay. It feels like their action directly caused the response. This is ideal for things like clicking buttons, typing in search bars, or UI animations.
1 second – Feels Smooth:
A short delay is noticeable, but users stay engaged without feeling interrupted. This is acceptable for web applications, API calls, and database queries.
10 seconds – Feels Slow:
A long response time, like 10 seconds, can frustrate users and make them lose interest in using your application. If a task takes this long, it’s best to show a loading indicator or progress bar.
Financial Trading Platforms System
In high-performance computing environments, like financial trading systems, response time requirements are far more stringent due to the need for real-time execution.
Microsecond-Level Response Time:
High-frequency trading (HFT) platforms demand ultra-low latency to execute trades within microseconds. For example, the London Stock Exchange Group (LSEG) provides a real-time direct data feed, which delivers market data with a latency as low as 20 microseconds (for 99.99% of updates).
Nanosecond-Level Optimization:
Some ultra-low-latency trading systems use specialized hardware, such as FPGA-based acceleration, to further reduce processing times to nanoseconds, ensuring near-instantaneous trade execution.
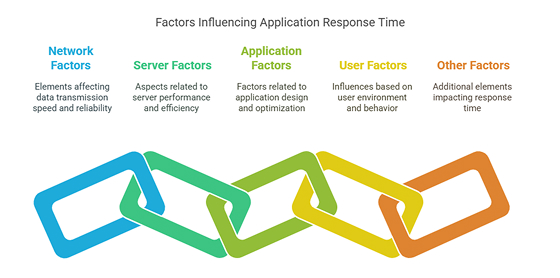
Factors that Affect Application Response Time

- Network factors:
- Bandwidth
- Latency
- Congestion
- Distance between user and server
- Server factors:
- Hardware performance (CPU, RAM)
- Load
- Database query efficiency
- Application factors:
- Application complexity
- Code optimization
- Caching mechanisms
- Algorithm efficiency
- User factors:
- User location
- Device capabilities
- Number of concurrent users
- Other factors:
- Peak usage periods
- System integration
- Security checks
- Algorithm efficiency
How to Calculate Application Response Time
You can easily calculate application response time using this formula:
Application Response Time(ART) = Time at Response Completion − Time at Request Initiation For example, if a user clicks a button at 12:00:00.100 and receives a response at 12:00:01.200, the response time is:
1.200 – 0.100 = 1.1 seconds
How to Measure a Web Application’s Response Time
Using Google Chrome Developer Tools
You can measure response time using Chrome DevTools:
- Open Chrome DevTools : Press F12 or Ctrl + Shift + I.
- Go to the network tab : Reload the page to capture request timings.
- Analyze performance metrics : Look at:
- Time to First Byte (TTFB) : The time it takes for the server to respond.
- DOM Content Loaded (DCL) : How long it takes to load the page, including CSS, JavaScript, and images.
Using Performance Testing Tools
For more structured response time measurement, follow these steps:
- Define what to measure : Identify key areas such as API response or page load time.
- Choose a testing tool : Use tools like JMeter, LoadRunner, or K6 to analyze performance.
- Create test scenarios : Set up automated tests to simulate real-world interactions.
- Run the tests and analyze the data : Measure response time under different loads and conditions.
Application Response Time Monitoring
Continuous monitoring helps ensure smooth performance and quick issue detection. Monitoring tools collect data, visualize performance, and send alerts when response times degrade.
Monitoring Web Applications
For web applications, JavaScript-based monitoring tools can track server response time and page load times. Popular tools include:
- New Relic
- Dynatrace
- AppDynamics
- Datadog
- Pingdom
Monitoring Mobile Applications
Mobile apps require tracking of network call durations, internal processing speed, and battery/memory usage. The following tools can help:
- Firebase Performance Monitoring
- App Center
- Instabug
- AppDynamics Mobile
Monitoring APIs and Backend Services
Backend performance monitoring focuses on database query execution times, inter-service communication speeds, and internal process execution times. Useful tools include:
- Prometheus + Grafana
- New Relic
- Datadog
- Jaeger
- Zipkin
Ways to Enhance Application Response Time
- Use a content delivery network (CDN)
A CDN (e.g., Cloudflare, Akamai, AWS CloudFront) delivers static content from servers closer to users. This significantly reduces the application load time. - Implement caching strategies
Caching tools like Redis or Memcached help store frequently accessed data. This reduces the number of database queries and improves response time. - Optimize images
Using modern image formats like WebP and applying lazy loading reduces image sizes and improves page speed. - Optimize code
Minify JavaScript and CSS to reduce file sizes.
Eliminate unused code to improve efficiency.
Optimize database queries for faster execution.
Conclusion
Application response time directly impacts user experience and business success. By following response time standards, continuously monitoring performance, and applying optimization techniques, applications can deliver faster responses and rank higher in benchmarks for web application response time.

