Modern teams release new features every day, but many still rely on guesswork to judge how fast, safe, and repeatable their processes are. The developer velocity index reveals gaps in flow, quality, and team morale, then distills them into a few clear numbers that guide discussion and justify investment.
What Is the Developer Velocity Index?
The developer velocity index is a custom score that teams use to reveal gaps in flow, quality, and morale. It distills several metrics into a few clear numbers that guide discussion and justify investment. Unlike universal benchmarks such as DORA metrics, each team can define its own formula and weights.
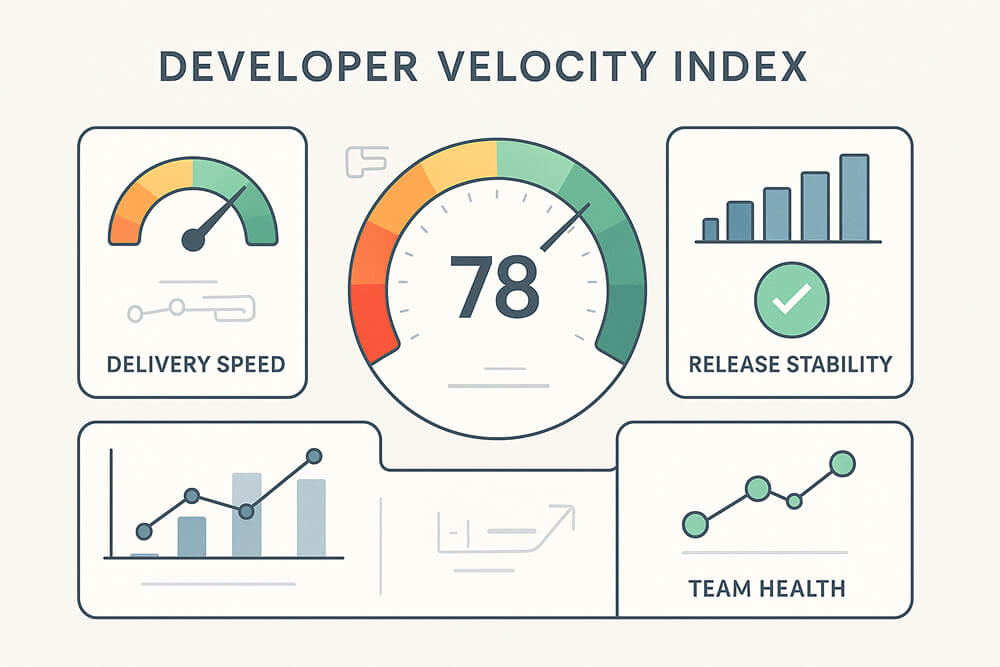
Teams often normalize this composite score to a 0-100 scale for readability. A typical developer velocity index includes three areas:
- Delivery speed: the time it takes for new code to go from commit to production. It is a measure of the overall speed of software development.
- Release stability: how often releases meet service goals and don’t need to be rolled back. This shows how stable the overall delivery is.
- Team health: short surveys that capture issues with tools, process, or morale.
At the end of every sprint, an automated job collects these numbers, applies set weights, and updates a shared dashboard. If lead time grows or rollbacks rise, the developer velocity index drops. Faster tests, smoother deploys, and good feedback loops raise it.
Core Metrics
These are the data points that drive every developer velocity index update:
- Lead time: The total time from code commit to production deploy (aligned with DORA’s definition). Shorter lead times lift development velocity.
- Change failure rate: The percentage of releases that need to be rolled back or fixed right away. Higher delivery stability means lower rates.
- Mean time to restore (MTTR): The total time from a page (urgent on-call alert) to full recovery. Faster recovery improves both development velocity and overall developer velocity index.
- Deployment frequency: The number of successful pushes to production per day. Frequent deploys increase velocity in software development.
- Team sentiment: This is measured through a short survey on tooling, autonomy, and psychological safety, scored on a 1-5 scale. Results are directional rather than precise, but help surface issues that affect long-term velocity.
Measurement Methods
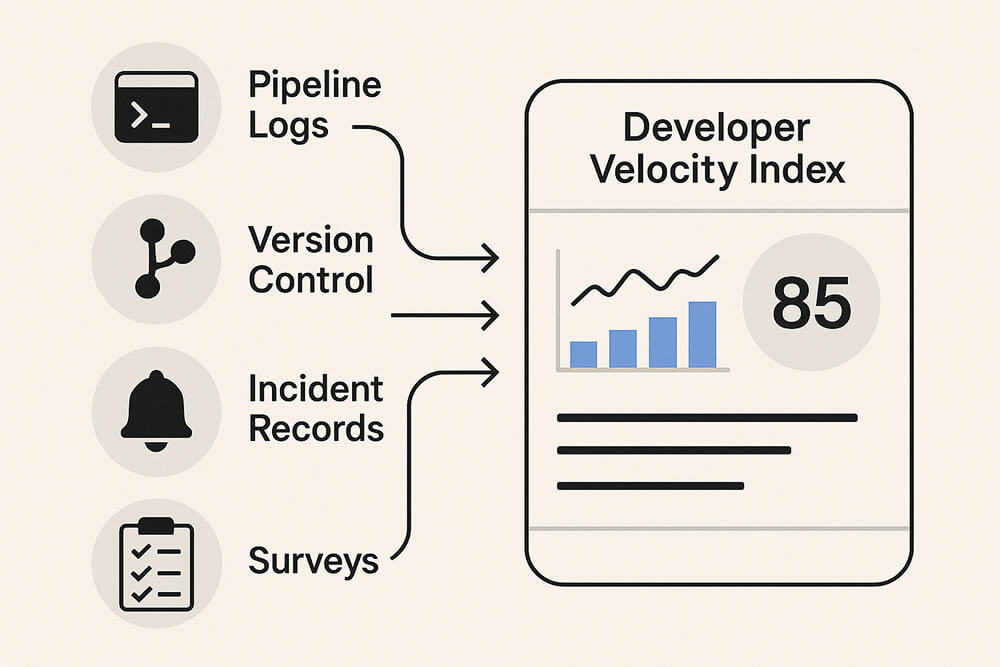
To maintain the accuracy of the developer velocity index, collect each metric in the same way every sprint and store the data in a location where it can be easily accessed and checked.
- Pipeline logs: Read build and deploy logs to count releases, measure lead time, and spot rollbacks. A log scraper that runs after each deploy keeps the numbers current.
- Version-control data: Pull commit times and pull-request merges to confirm how quickly code is moved. Tag each merge with the build ID that reaches production so that the numbers align.
- Incident records: Scan on-call tickets to find mean time to restore (MTTR) and alert noise. Link each ticket to the release that caused it to show the real cost of low performance velocity.
- Quick surveys: Send five yes/no or 1-to-5 questions at the end of the sprint. Combine the answers into the team-health part of the score.
Challenges & Limitations
The developer velocity index delivers clear insights, yet it also has practical limits that teams must manage.
- Metric gaming: Teams may chase numbers (for example, many tiny commits) rather than real improvements. A clear review process and peer checks reduce this risk.
- Data gaps: Missing logs, broken scripts, or repo migrations can skew the developer velocity index. Automate data validation and alert on anomalies.
- One-size weights: A mobile app team and an embedded firmware team need different weightings. Review weights at least once per quarter.
- Survey fatigue: Frequent polls lower response quality and hide morale issues. Keep surveys short and run them at most once per sprint.
- Context blindness: The developer velocity index shows trends but not the reasons behind them. Conduct a quick retro with each drop to identify the actual issue.
Tips & Best Practices
Healthy habits keep the developer velocity index useful and guard against the limits listed above.
- Start narrow: Track lead time and MTTR for two sprints before adding other inputs.
- Automate collection: Use one scheduled job per data source and fail the job when data is missing; manual uploads are prone to errors.
- Embed in retros: Discuss the developer velocity index trend at every sprint review.
- Share dashboards openly: Give everyone read access. Visibility discourages metric gaming and surfaces hidden blockers.
Conclusion
The developer velocity index takes delivery data that isn’t very organized and turns it into one clear score that balances speed, stability, and team health. It cuts down on guesswork, shows where there are problems, and backs up funding requests with proof.
Begin with small steps: keep track of lead time and mean time to restore, weigh them out, and share the trend at the end of each sprint. Only add more inputs when the data remains clean and the conversations stay on track, focusing on real improvements rather than the numbers themselves.