In Agile project management, various tools and techniques ensure projects stay on track, deadlines are met, and goals are achieved. Among these, the release burndown chart stands out as an essential metric for teams aiming to deliver high-quality products efficiently and effectively.
What is a Release Burndown Chart?
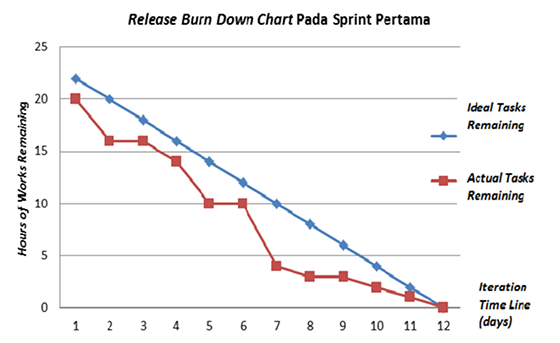
A release burndown chart visually depicts the work that is still pending in a sprint. The x-axis represents time, and the y-axis represents work remaining in story points, tasks, or hours. As work completes the measurement, the team can see whether they are on track to complete the release on the target date.
Key Components of a Release Burndown Chart

Source: ResearchGate
- X-Axis (Time): Denotes the timeline for the release. This is usually split into sprints or iterations.
- Y-Axis (Work Remaining): This measures work left to be done. These numbers are usually in the form of story points, tasks, hours, or any other quantifying unit.
- Ideal Work Line: The diagonal work progression line illustrates the optimal outcome to be achieved at any period within the specified time frame to complete the release.
- Actual Work Line: This line demonstrates how the team’s work is progressing compared to the expected work completion.
Why Use a Release Burndown Chart?
A release burndown chart helps predict and detect problems, contributes to proper planning, and increases team performance. Furthermore, it helps stakeholders and team members quickly monitor the sprint’s progress using a simple chart.
- Transparency and Accountability
Stakeholders understand the progress of a project with release burndown charts. There is no chance to cover up issues. Additionally, these charts allow team members to determine whether they are on schedule, ahead, or falling behind. - Early Detection of Issues
If the actual work line strays too far from the ideal work line, there can be issues like sudden scope changes, resource limitations, or estimation issues. With release burndown charts, you can easily identify this within a few sprints and address them promptly before it’s too late. - Improved Planning and Forecasting
Using release burndown charts, teams can properly allocate resources, prioritize tasks, and plan sprints more accurately. They can also make better adjustments to their tactics to improve their chances of achieving the set release objectives. - Motivation and Focus
The release burndown chart further enhances motivation and morale by showing measurable progress toward achieving goals. Moreover, it acts as a reminder to finish individual tasks within the allocated time.
How to Create an Effective Release Burndown Chart

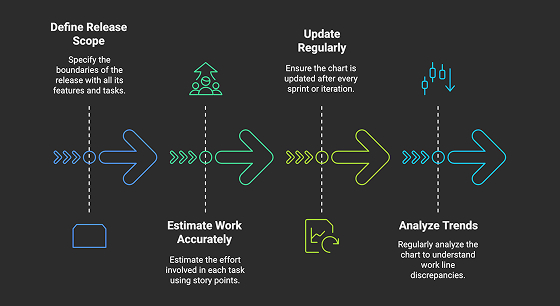
- Define the Release Scope
Specify the boundaries of the release with all its features, user stories, and other tasks that will be completed in that release. This enables accurate tracking and measurement from the outset. - Estimate Work Accurately
Estimate the effort involved in each task using story points or their equivalents. Ensure that the estimates are within a realistic range and agreed upon by the whole team. - Update Regularly
Make sure that the chart is updated regularly after every sprint or iteration. This ensures that the chart depicts the project’s most up-to-date status. - Analyze Trends
Analyze the chart regularly. If the actual work line is continuously lower than the ideal one, find out why this is happening and try to solve it.
Common Challenges and Solutions
- Inaccurate Estimates
Work estimation can be difficult. Try promoting experience to the team and include older members in estimations. - Scope Creep
Changes in the project scope that are not managed may affect the release schedule. Use proper change control and carry out periodic task reviews and re-prioritization. - Resource Constraints
Not having the appropriate amount of resources may stall work. Make sure the team has the tools, help, and personnel needed to carry out the assigned tasks.
Conclusion
Release burndown charts are simple yet powerful tools in Agile project management. They provide clear insight into progress, enhance accountability, and help teams stay on track. By accurately tracking and visualizing remaining work, teams can improve planning and forecasting and ultimately increase their chances of delivering high-quality releases on time.
