Why are Flow and DORA metrics better together?
Written by

Status
answered
Written by
Status
answered
In modern software development, tracking progress isn’t just about story points or sprint velocity. To really understand how your team is doing, you need to look at both how fast you deliver and how smoothly work moves through your system. That’s where DORA and flow metrics come in.
On their own, each metric tells part of the story. But when you use them together, you get a much clearer picture of your team’s performance, which helps you find bottlenecks, improve software delivery performance, and build more reliable software.
DORA (DevOps Research and Assessment) metrics focus on performance outcomes. They measure:
These are widely used in DevOps teams to measure velocity, quality, and stability.
Flow metrics belong to the Flow Framework. They help you understand how work moves through the value stream. They include:
These are often called value stream metrics because they reveal bottlenecks, delays, and imbalances in your software development process.
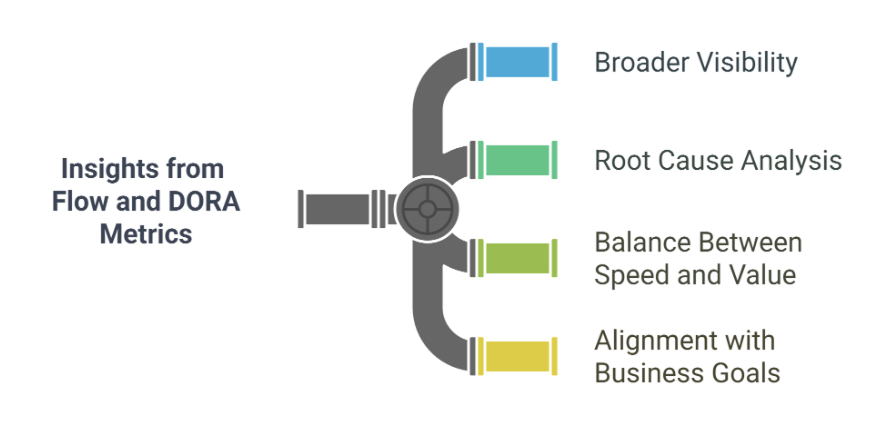
While DORA tells you what happened and how often, flow metrics explain why it happened and where the slowdowns are. Here’s how they complement each other:
DORA metrics show delivery outcomes, but they don’t explain underlying inefficiencies. Flow metrics fill that gap by tracking how work flows through the pipeline.
If your lead time spikes in DORA, flow time and flow efficiency can help you determine whether the spike is caused by long wait times or overloaded teams.
DORA metrics focus on speed and recovery, while flow metrics focus on value delivery. Together, they ensure you’re not just shipping faster but smarter.
Flow metrics connect to business value (e.g., more features, fewer blockers), making them a great pairing with DORA for stakeholders who care about ROI.
Imagine your change failure rate has increased. DORA metrics signal the issue, but the flow distribution reveals too many risky items being rushed without proper QA. Together, these metrics empower smart decisions.
“You can’t improve what you don’t measure,” as the saying goes. But what you measure and how you interpret it matters even more.
By blending flow metrics and DORA metrics, teams can move from just tracking delivery to truly optimizing software delivery metrics. This integrated view leads to faster, higher-quality releases and better alignment with both engineering and business outcomes.