What are key Scrum metrics to track?
Status
answered
Status
answered
In Scrum, tracking the right metrics helps teams stay on track and continuously improve. Metrics offer insight into the team’s productivity, efficiency, and performance, showing what is effective and what requires improvement. By using this information, teams can solve challenges and refine their approach for future sprints.
The following are fundamental scrum metrics that every Scrum master and Agile team should use.
The story completion ratio is a fundamental metric that measures the percentage of work completed by the team compared to what they committed to during sprint planning. A consistent story completion ratio shows that the team is effective in planning and executing their workload.
Why track it? It shows gaps between the plan and actual delivery. The goal is to improve estimation accuracy for future sprint planning.

Example: If the team commits to completing 10 user stories during sprint planning but completes only 8, the story completion ratio is:
Completed story points = 8
Total story points = 10
SCR = 8/10 * 100% = 80%
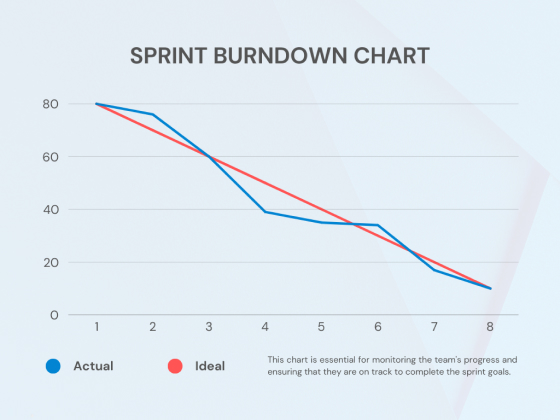
A sprint burndown chart is one of the essential Scrum master metrics that tracks the amount of work remaining throughout a sprint. This chart is useful for monitoring the team’s progress in completing all planned tasks.
Why track it? It helps Scrum masters quickly spot potential issues in meeting sprint goals and take prompt actions to resolve them.
Technical debt refers to compromises in code quality made for short-term gains, which often cause problems later. The technical debt index measures the amount of technical debt accumulated by the team compared to the overall scope of the project.
Why track it? A lower technical debt index ensures that no compromises are made in the code quality that will be expensive to fix later.

Example: Assume a project takes a total of 1000 hours to develop, and 100 hours of that have been spent to fix technical debt. In that case, the technical debt index is:
Hours to fix debt = 100
Total development hours = 1000
TDI = (100 / 1000) * 100 % = 10%
The most common team metric used in Scrum is velocity. This measures the average number of story points a team can deliver in a sprint. Teams use velocity over time to make informed predictions on how much work they can handle in future sprints.
Example: If a team completes 100 story points over four sprints, then its velocity is 25.
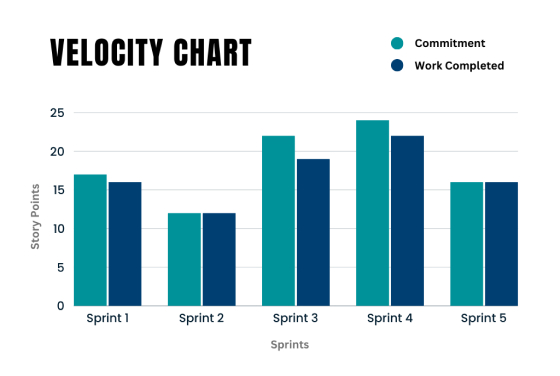
Note: Velocity is not productivity but rather a planning tool that projects future sprints based on historical data.
The escaped defects metric represents the number of bugs or issues that “escape” the testing process and reach the end user.
Why track it? It gives insights into the quality of the delivered product. A decreasing number of escaped defects usually indicates improvements in testing and quality processes.

Example: Consider an example where the QA team identified 150 defects during testing, and customers reported another 30 defects not noticed during the testing. Here, the defect escape rate can be calculated as follows:
Number of defects found post-production: 30
Total number of defects: 150 (during testing) + 30 (post-production) = 180
DER = (30/180) x 100 ≈ 16.67%
Sprint goal success is a metric indicating whether the team has successfully reached the goals set out for each sprint. These are usually given at the beginning of each sprint to give direction and meaning to the work being done by the team.
Why track it? If sprint goals are not met continuously, then either the goals are unrealistic, or there are difficulties in reaching those goals. It helps in more effective planning in subsequent sprints.
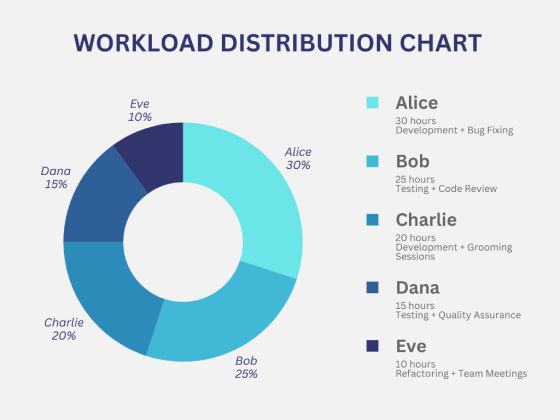
Workload distribution measures how much work each team member handles in comparison with their peers.
Why track it? It allows Scrum masters to spot disparities in workload. Some members may be overburdened, while others may be underutilized. A balanced workload leads to a more efficient and satisfied team.
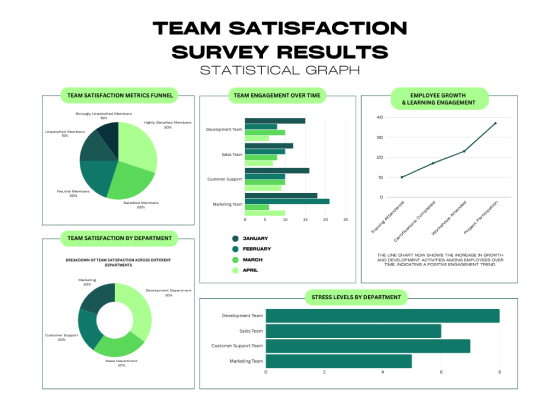
Team satisfaction is a significant concern for long-term success within a team. Ongoing checks on work/life balance, happiness, and motivation ensure a healthy working environment. You can use surveys, one-on-one discussions, and feedback sessions to measure satisfaction.
Why track it? High satisfaction correlates with effective teamwork and better product outcomes.
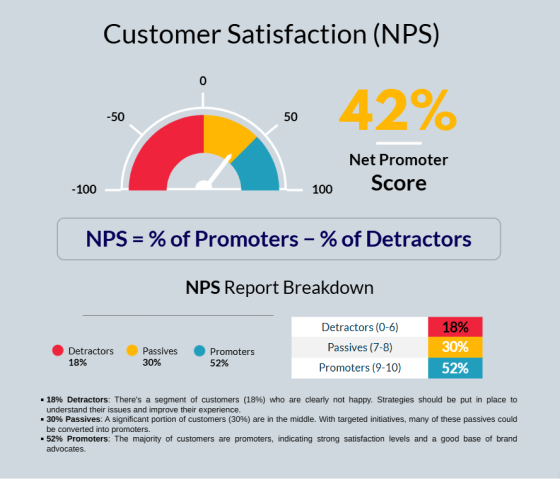
Customer satisfaction is often measured through the net promoter score. The NPS will tell whether the end-users are satisfied with the product and would recommend the product to others.
Why track it? Monitoring the scores of NPS over time enables Agile teams to understand if they are serving user needs effectively, thus making necessary adjustments in product development.
Tracking the right Scrum metrics is key for Agile teams to enhance efficiency, effectiveness, and alignment with their goals.
These Agile sprint metrics help the Scrum master and Agile teams regularly measure and analyze their progress for higher quality work and better overall product outcomes.
