What are the different categories of KPIs for engineering teams?
Written by

Status
answered
Written by
Status
answered
Key performance indicators (KPIs) function like a scorecard for engineering. KPIs for engineering teams are quantifiable benchmarks that show if value is being delivered, reliability is being maintained, and operational workflows are improving.
However, a software team’s activities cannot be condensed to a single metric such as deployment frequency, MTTR, or velocity. This is why engineering KPIs are organized into categories. Each category addresses a question from a specific group of stakeholders:
When these categories are visualized on an engineering KPI dashboard, leaders at every level can see where to focus and why.
These indicators show whether engineering effort is turning into customer and company value. Typical metrics include:
Even flawless code and fast pipelines fail the test if they do not progress business-level goals. Pairing value KPIs with delivery metrics prevents “shipping for the sake of shipping.”
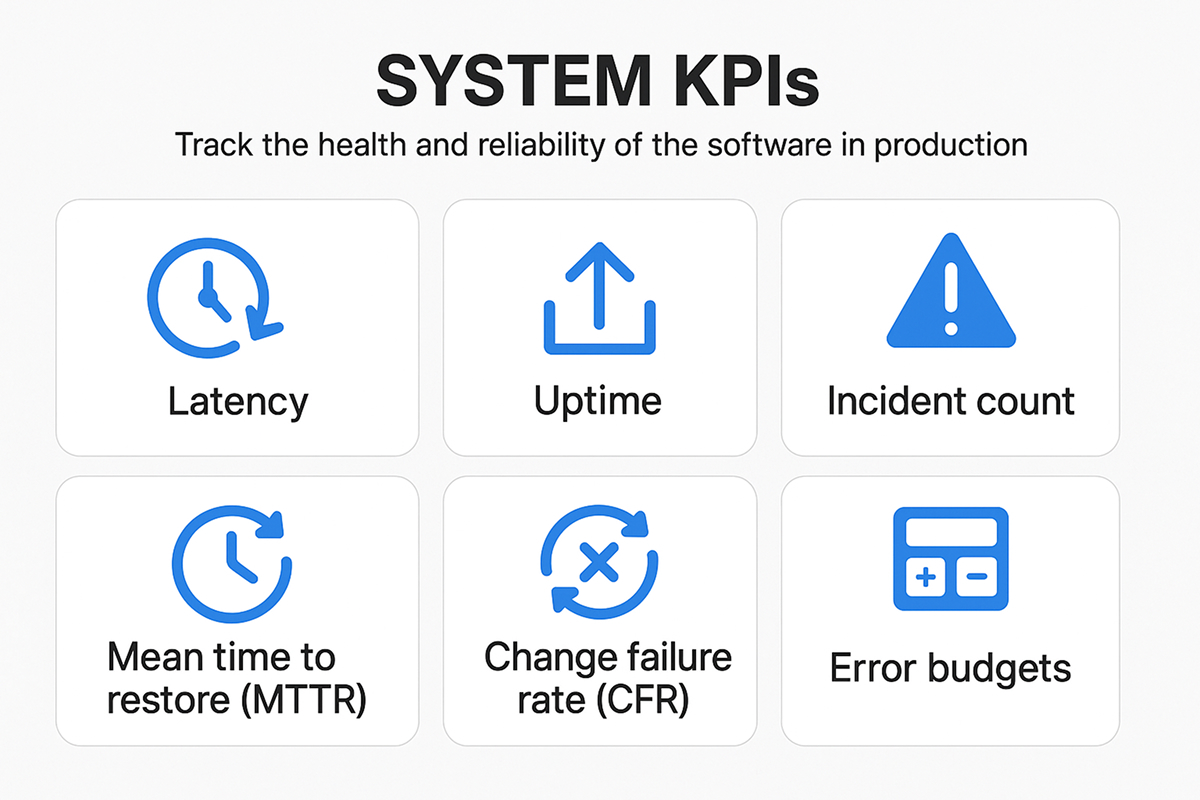
System KPIs track the health and reliability of the software in production. Common measures in this category include:
Reliable systems protect brand reputation and free engineers from firefighting so they can focus on planned work.
Velocity and flow metrics tell you how quickly high-quality code moves from idea to production. Examples include,
Faster feedback loops shorten time-to-market, reduce context-switching, and boost team morale.
These are the process indicators that monitor the efficiency of internal workflows. Examples include:
Good processes create the foundation on which sustainable speed, quality, and satisfaction are built.
Input KPIs measure the resources allocated to engineering work. This includes people, budget, compute hours, or story points. Tracking input alongside output avoids overworking teams by driving velocity.
Input KPIs protect teams from hidden overwork, expose capacity constraints early, and help defend realistic planning.
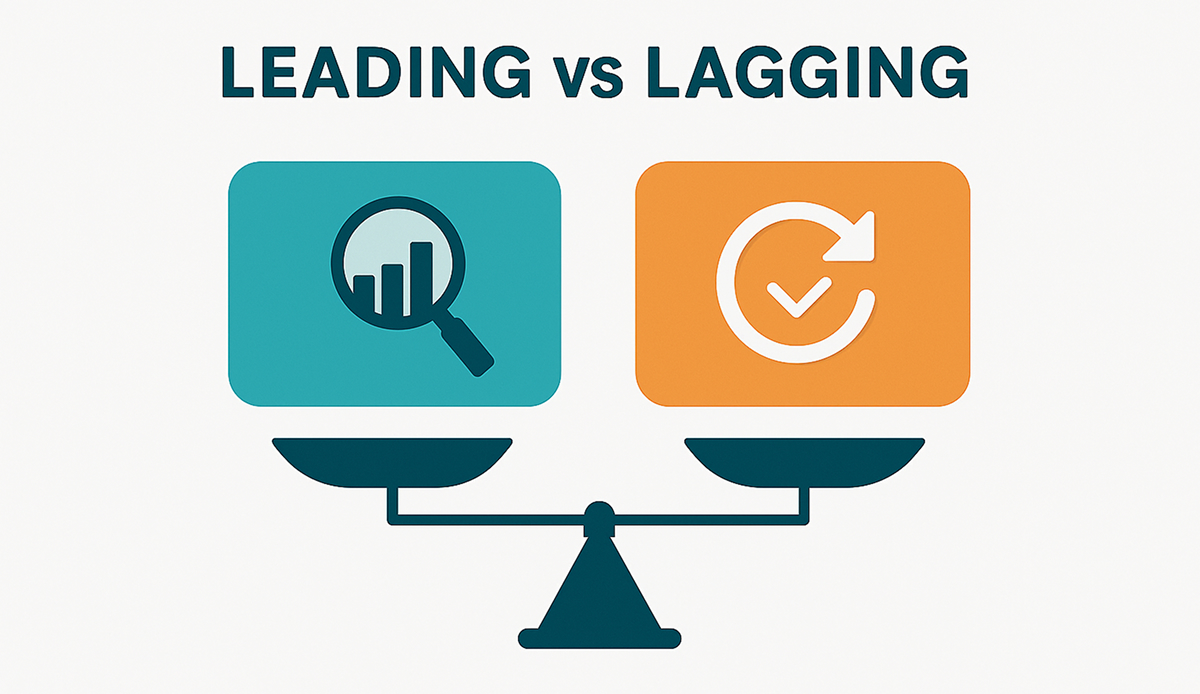
It is recommended to tag every KPI as either leading or lagging so teams know whether they should look ahead or look back.
Balancing the two lets teams act proactively (leading) while still holding themselves accountable for results (lagging).
Quantitative KPIs are the hard numbers you can count or calculate. They give you a clear picture of how much work is flowing through the pipeline and how efficiently it’s moving. Examples include:
Qualitative KPIs capture opinions and feelings gathered from the people doing the work. These signals reveal the human side of engineering, like confidence, frustrations, and cultural factors that numbers alone can’t show. You can get them through:
A single software engineer KPI rarely tells the full story. Start by mapping each strategic objective to at least one KPI in the categories above, then review quarterly:
Categorizing KPIs clarifies why a number matters and who should act on it. Here are some best practices to keep in mind:
By grouping KPIs, you gain a comprehensive overview of productivity, quality, and value, aiding decision-making and facilitating continuous improvement.