7 Value Stream Mapping Tools for Software Delivery
8 min read• Apr 22, 2026
Written by

Milestone Team

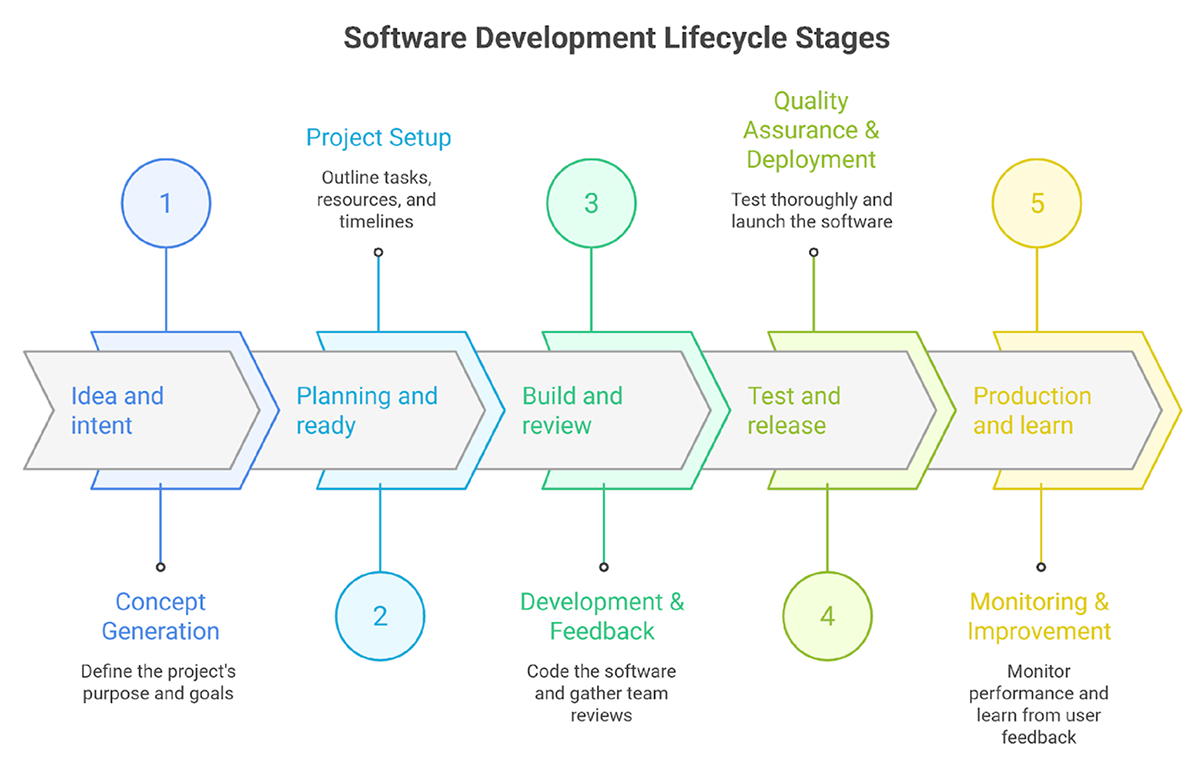
Modern software delivery is no longer a straight line from coding to release. Work moves through planning, design, implementation, review, testing, security checks, and deployment, often across multiple teams and tools. When the path is invisible, teams tend to optimize the part they control, while delays quietly build up elsewhere in the system.
Value stream mapping, or VSM, makes that end-to-end path visible. It shows where work is waiting, bouncing between teams, and where dependencies create stop-and-go delivery. Instead of debating opinions, you can point to specific bottlenecks and queue time and decide what to fix first.
This is why flow visibility matters more than raw development speed for many teams today. A fast engineer still cannot ship if reviews stall, test environments are scarce, or releases depend on another group’s calendar. Teams that actively optimize flow remove friction earlier, deliver more predictably, and learn faster from production. Over time, that becomes a competitive advantage, because the organization can move with confidence while others are still stuck pushing work through hidden queues.
Value stream mapping is the act of visualizing the steps and handoffs involved in delivering a product or service to identify waste and improve efficiency.
Value stream management is broader. It includes mapping, continuous measurement, governance, and decision support across portfolios and teams. ServiceNow describes value stream mapping as a subset of value stream management, focused on the steps, while management integrates the wider workflow and outcomes.
That difference matters because modern toolchains are noisy. Jira tells one story. Git tells another. Your CI system tells a third story. A good set of value stream management tools connects these stories and presents them as a single view.
Many teams already have analytics dashboards. So what’s different with VSM tools? Traditional delivery analytics often focuses on activity inside a single domain:
Those metrics are useful, but they can miss the full path.
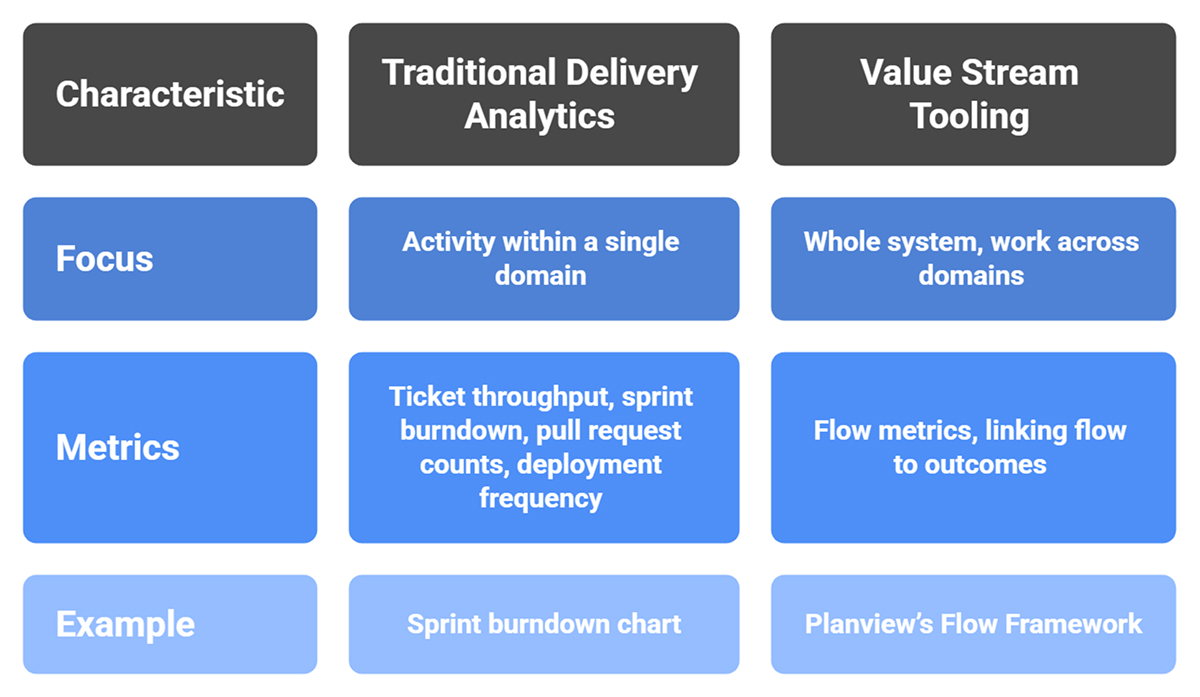
Value stream mapping tools aim to show the whole system: how work moves across planning, coding, review, testing, release, and production.
They also tend to emphasize flow metrics. For example, Planview’s Flow Framework approach centers on measuring flow and linking it to outcomes.
A VSM tool only helps if it aligns with how work actually flows through your organization and if people trust the data. When engineering leaders evaluate tools, five areas usually matter most:
Start with the basics: can it connect to your real toolchain? You typically need strong support for Jira or Azure DevOps, plus GitHub or GitLab, and your CI or CD systems. Also, check how it handles data normalization. If teams use different statuses, labels, or workflows, the tool should still let you map them into a consistent flow model without forcing everyone into the same process.
Look for near-real-time reporting, transparent metric calculations, and definitions you can understand and adjust. DORA metric support is a good signal, but only if the tool is clear about what it counts as “start” and “end” for lead time, cycle time, and deployments. If definitions are vague, you’ll end up optimizing the wrong bottleneck.
You want workflow views that are easy to read in a weekly review. The tool should let you model your own stages, highlight wait time and queue build-up, and show how work flows across teams without burying you in charts. A good dashboard answers one question quickly: where is work getting stuck right now?
If you operate across more than a few teams, check portfolio rollups, access control, and security requirements early. Many tools look fine at the team level, then struggle when you need org-wide reporting, permissions, and compliance-friendly data handling.
Finally, make sure the tool aligns with leadership’s thinking. Executives need initiative-level views, forecasting support, and a clear link to outcomes, not just ticket counts. If a platform cannot connect the delivery flow to business goals, it will stay stuck in engineering dashboards.
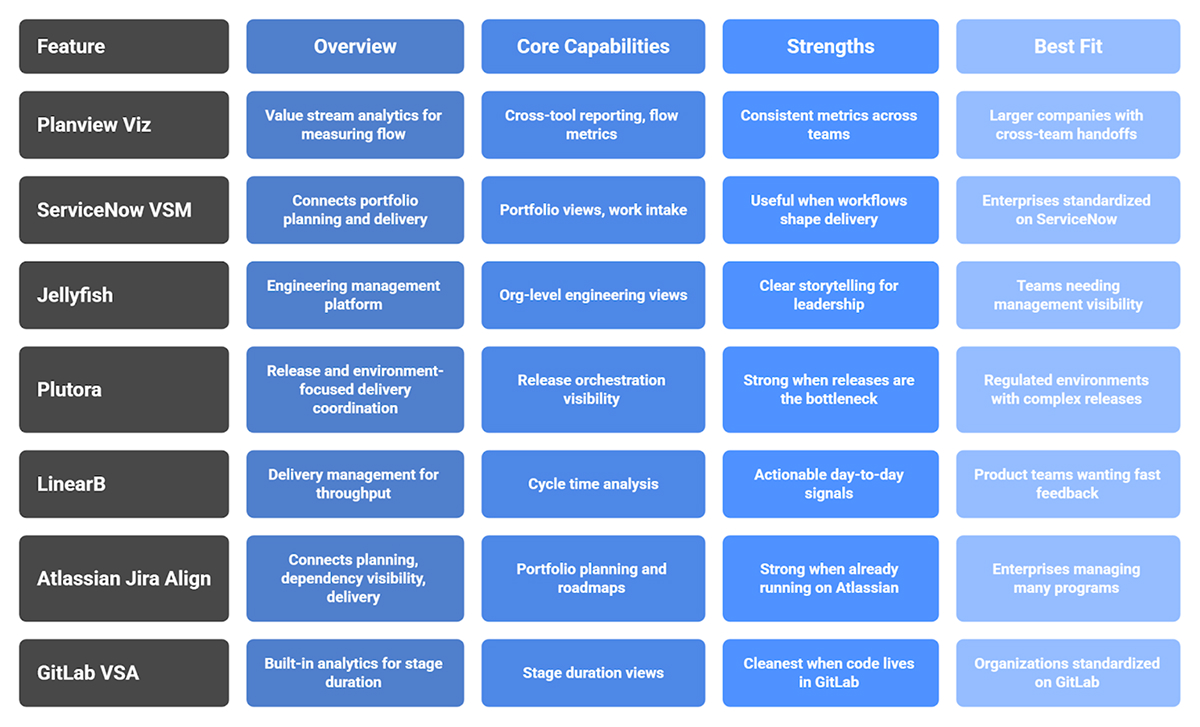
VSM tools are not all built for the same job. Some are portfolio-first, some are engineering-execution-first, and some are strongest when they sit inside the delivery platform you already use. Here are seven common options and when they fit best.
If you want a quick comparison, the table below summarizes the seven tools by focus and best fit.
Value stream tools work best when they serve two audiences using the same underlying flow data. Engineers need clarity on where work is getting stuck so they can remove friction quickly. Leaders need a reliable view of whether important initiatives are on track, what is creating risk, and how engineering effort translates into business outcomes. A good VSM tool connects these needs through one shared model of the delivery system.
For teams close to the work, VSM tools make delays visible at the stage level. They show where bottlenecks form, whether cycle time is improving or drifting upward, and where work is waiting instead of moving. This visibility helps teams control work in progress, reduce rework and queue time, and make deployments more predictable by stabilizing the steps that most often cause delays.
At the leadership level, the same signals roll up into initiative visibility and planning confidence. Instead of relying solely on status updates, leaders can see how initiatives flow through the delivery system, where dependencies are slowing progress, and whether delivery risk is rising. Over time, consistent flow metrics also improve forecasting, because plans can be grounded in real throughput and historical timing rather than optimistic assumptions.
The biggest benefit is alignment. Engineers can explain delivery constraints with evidence, and leaders can make portfolio decisions based on the true system bottleneck. When both sides look at the same flow reality, it becomes easier to prioritize the right fixes and connect engineering improvements to measurable business outcomes.
Flow optimization matters because software delivery is a system. If the system is congested, an individual developer’s speed will not translate into shipping. Teams that continuously improve flow by reducing waiting, smoothing handoffs, and removing bottlenecks tend to deliver faster and more reliably over time.
Tool selection should match your organizational maturity, fit your existing toolchain, and support the decisions you actually need to make at both team and leadership levels. The takeaway is straightforward: when flow is visible, it can be improved, and that sustained improvement becomes a real competitive advantage.
When assessing which tools to integrate into your tech stack, consider integration consistency, alignment with your value stream mapping tools, visibility into work in progress, and identification of gaps and queue bottlenecks. For example, leaders need to trust the intelligence underlying governance (security, access/permission layers, and reporting structures) before they can govern tasks from a value stream mapping perspective.
Traditional analytics often report activity within a single system, such as tickets or deployments. VSM tools connect multiple systems to show the end-to-end flow, including waiting, handoffs, and dependencies, so that you can optimize the entire delivery path.
These metrics capture your flow efficiency: lead time, cycle time, and queue time. Support them with deployment frequency (stability metrics) and combine with the change failure rate and time to restore service. Speed and reliability are required and balanced by these key metrics.
Yes. Engineers use stage-level insights to reduce bottlenecks and stabilize delivery. Executives use rollups for initiative visibility, forecasting, and risk signals. The best tools present the same flow data at different levels without changing the truth.
Review flow metrics regularly, often weekly or biweekly, and update the map whenever workflows, tooling, or team structures change. A value stream map must reflect current reality, or it will drive the wrong priorities and hide real delays.
Sign up to our newsletter
By subscribing, you accept our Privacy Policy.