What Should I Present to the Board About Engineering Performance?
Written by

Status
answered
Written by
Status
answered
A board presentation on engineering performance should not start with a dashboard dump. Most board members do not want to review every sprint detail, pull request, or deployment chart. They want to understand whether engineering is helping the business move with control.
A useful engineering report connects delivery, risk, quality, and investment. The metrics matter, but only after the story is clear.
The board wants to know what engineering is enabling, what could slow the company down, and where leadership needs support. That sounds simple, but many engineering leaders still enter the meeting with too much operational detail.
A board does not need to know that one team reduced average PR review time by six hours unless that change helped unblock a product launch, reduce release risk, or improve customer response time. The same applies to build times, test coverage, incident counts, and cloud spend. Useful engineering metrics require business context.
A stronger opening is usually plain:
Engineering shipped the main customer-facing items for the quarter, but reliability work consumed more capacity than planned. Two infrastructure issues increased operational risk, so we are shifting investment toward platform cleanup ahead of the next enterprise launch.
That gives the board a sense of shape before the numbers arrive. It tells them that progress has occurred, that risk exists, and that investment choices are being made.
The best board-level engineering report usually has three parts: what moved forward, what is getting in the way, and what needs investment. This keeps the discussion away from raw activity and closer to decisions.
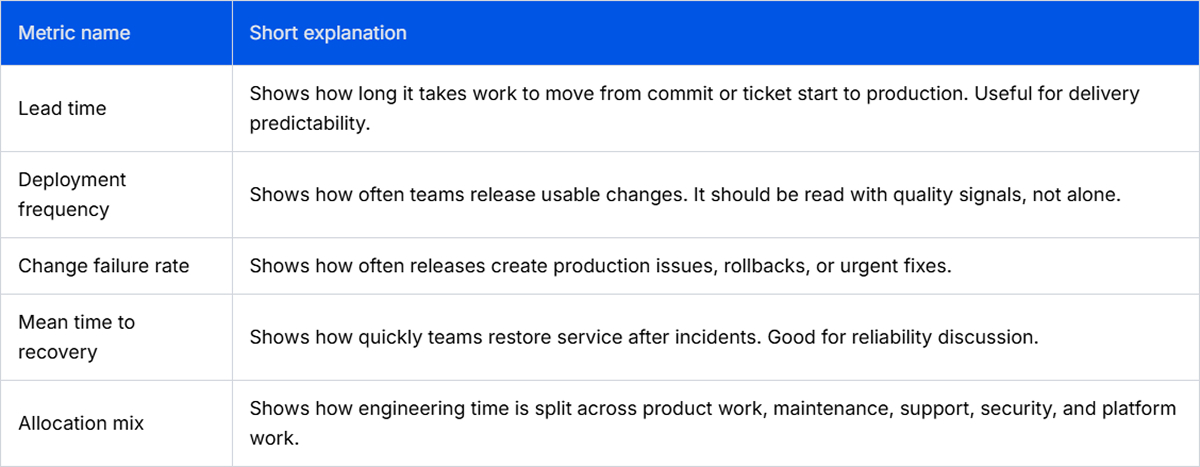
Software delivery metrics are useful here, but they should not stand alone. Deployment frequency, lead time, change failure rate, cycle time, incident recovery, and escaped defects can all help explain engineering performance. Still, a metric without interpretation often raises more questions than it answers.
A board-ready version should explain what changed and why. For example, if deployment frequency went up but change failure rate also increased, the story is not “we are shipping faster.” The story is that release speed improved, but quality control did not keep pace.
This is where benchmarks can help, but only if used carefully. Internal trend lines are usually more useful than generic comparisons. External references, such as engineering metrics benchmarks, can help frame the discussion, but the board still needs to understand your operating context.
Investment framing is just as important. If 35% of engineering capacity is going into support and reactive fixes, state that clearly. If AI coding tools are accelerating prototyping but creating review and governance pressure, say that too. For GenAI-heavy teams, it may also be useful to connect engineering performance reporting with AI governance for engineering leaders, especially when the board is asking about productivity, risk, and control at the same time.
Many board questions are predictable. They usually come after the first two slides, when the board tries to connect engineering work to money, risk, and timing.
Engineering leaders should be ready for questions like:
The last question is increasingly common. A board may hear that engineering has adopted AI assistants and assume productivity will rise quickly. The answer needs to be measured, not guessed. A tool like Milestone can help by showing GenAI adoption, workflow visibility, ROI signals, and engineering performance in one place, so leaders can see whether AI is improving delivery or only increasing code volume.
Do not defend engineering with vague statements like “the team is working hard.” That may be true, but it is not board-level evidence. Show the trade-offs. If a platform migration delayed two roadmap items but reduced incident risk for the next release cycle, explain it in direct language.
A good engineering report does not try to prove that every team is busy. It shows whether engineering is making progress at an acceptable level of risk. Keep the story simple. Use engineering metrics to clarify the situation, not to decorate the deck. The board needs confidence, but it also needs the real constraints.


